
Technical Analysis·
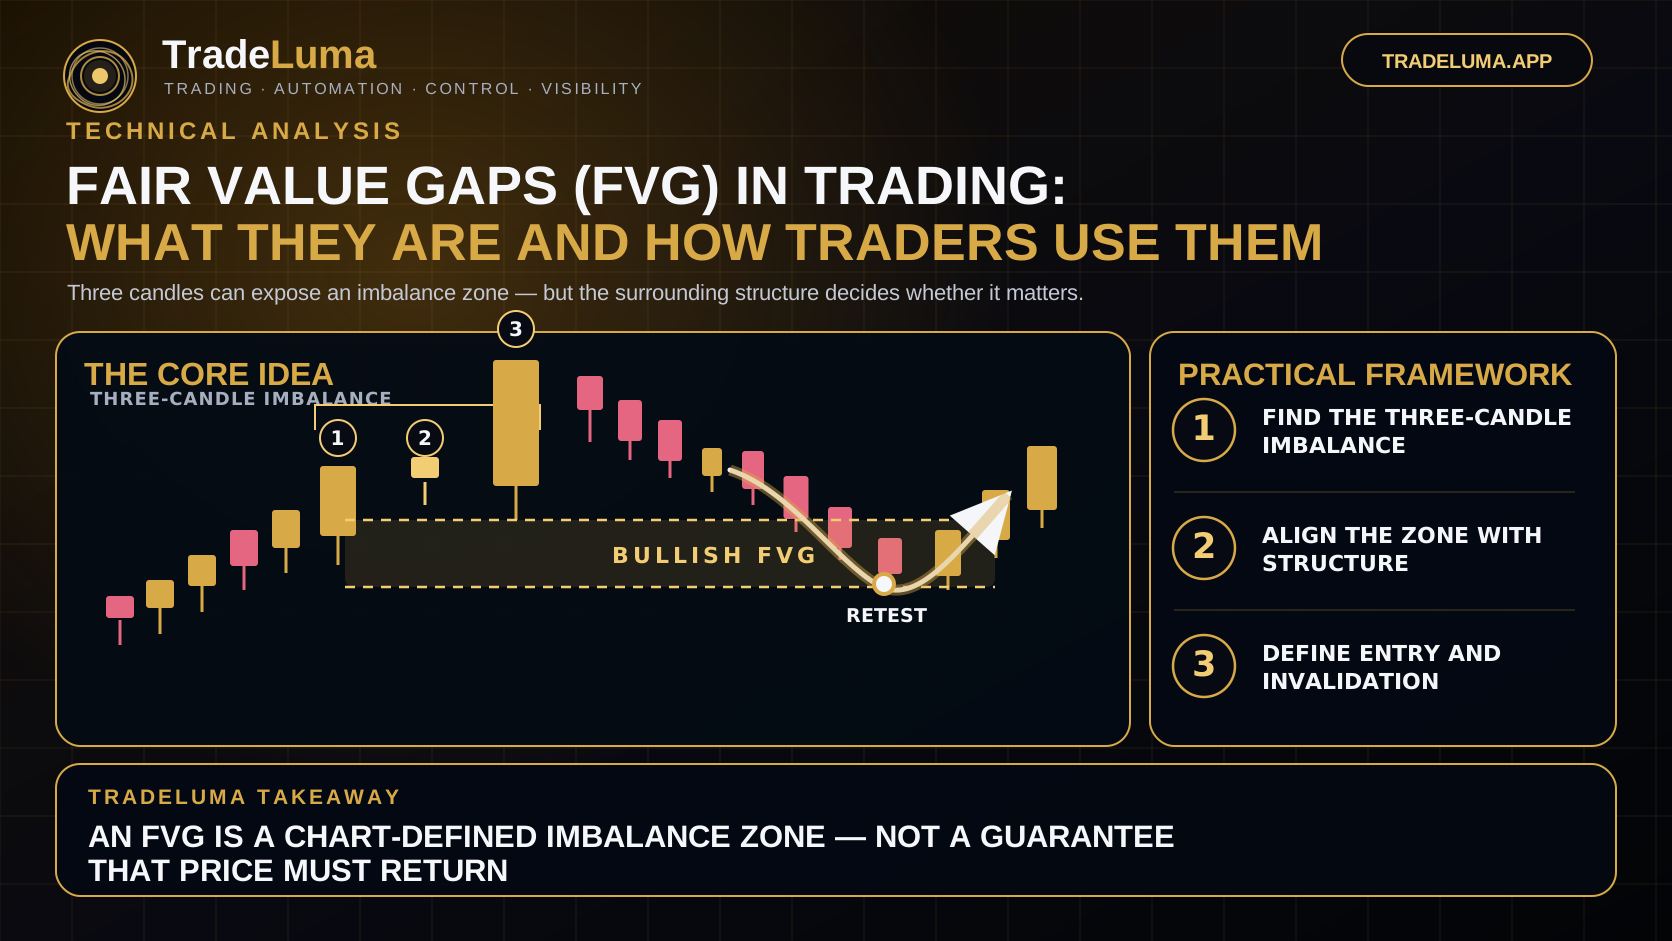
Fair Value Gaps (FVG) in Trading: What They Are and How Traders Use Them
Learn what fair value gaps are, how traders identify bullish and bearish FVGs, and how imbalance zones are combined with structure and risk.
Technical analysis
Learn market structure, price levels, chart patterns, trendlines, breakouts, volume tools, and practical technical analysis concepts.
Technical analysis is most useful when it turns chart information into repeatable decisions rather than predictions. These guides focus on structure, levels, trend behaviour, momentum, and confirmation.
The goal is to understand what price is doing, where a trade idea becomes invalid, and how different chart tools can support the same decision without creating unnecessary complexity.
Start with market structure and support or resistance, then add one or two tools that fit your timeframe. Test the complete process rather than judging an indicator or pattern from isolated examples.
Start here
Learn what fair value gaps are, how traders identify bullish and bearish FVGs, and how imbalance zones are combined with structure and risk.
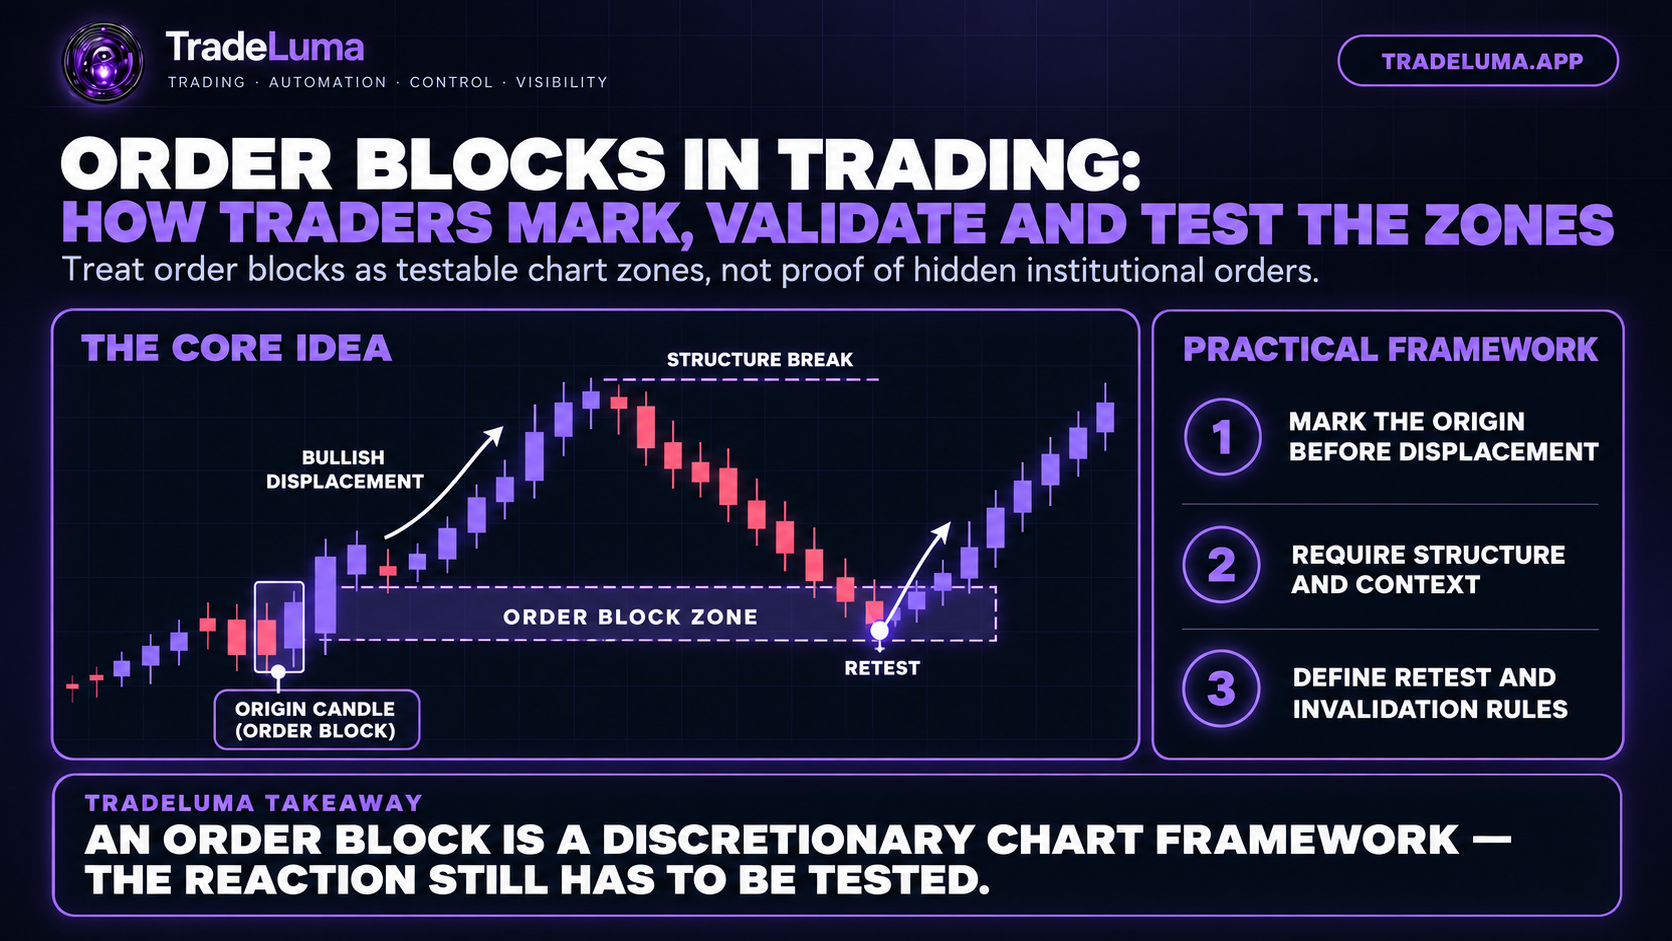
Learn what order blocks mean in technical analysis, how bullish and bearish zones are marked, and how traders test displacement, retests, and invalidation.
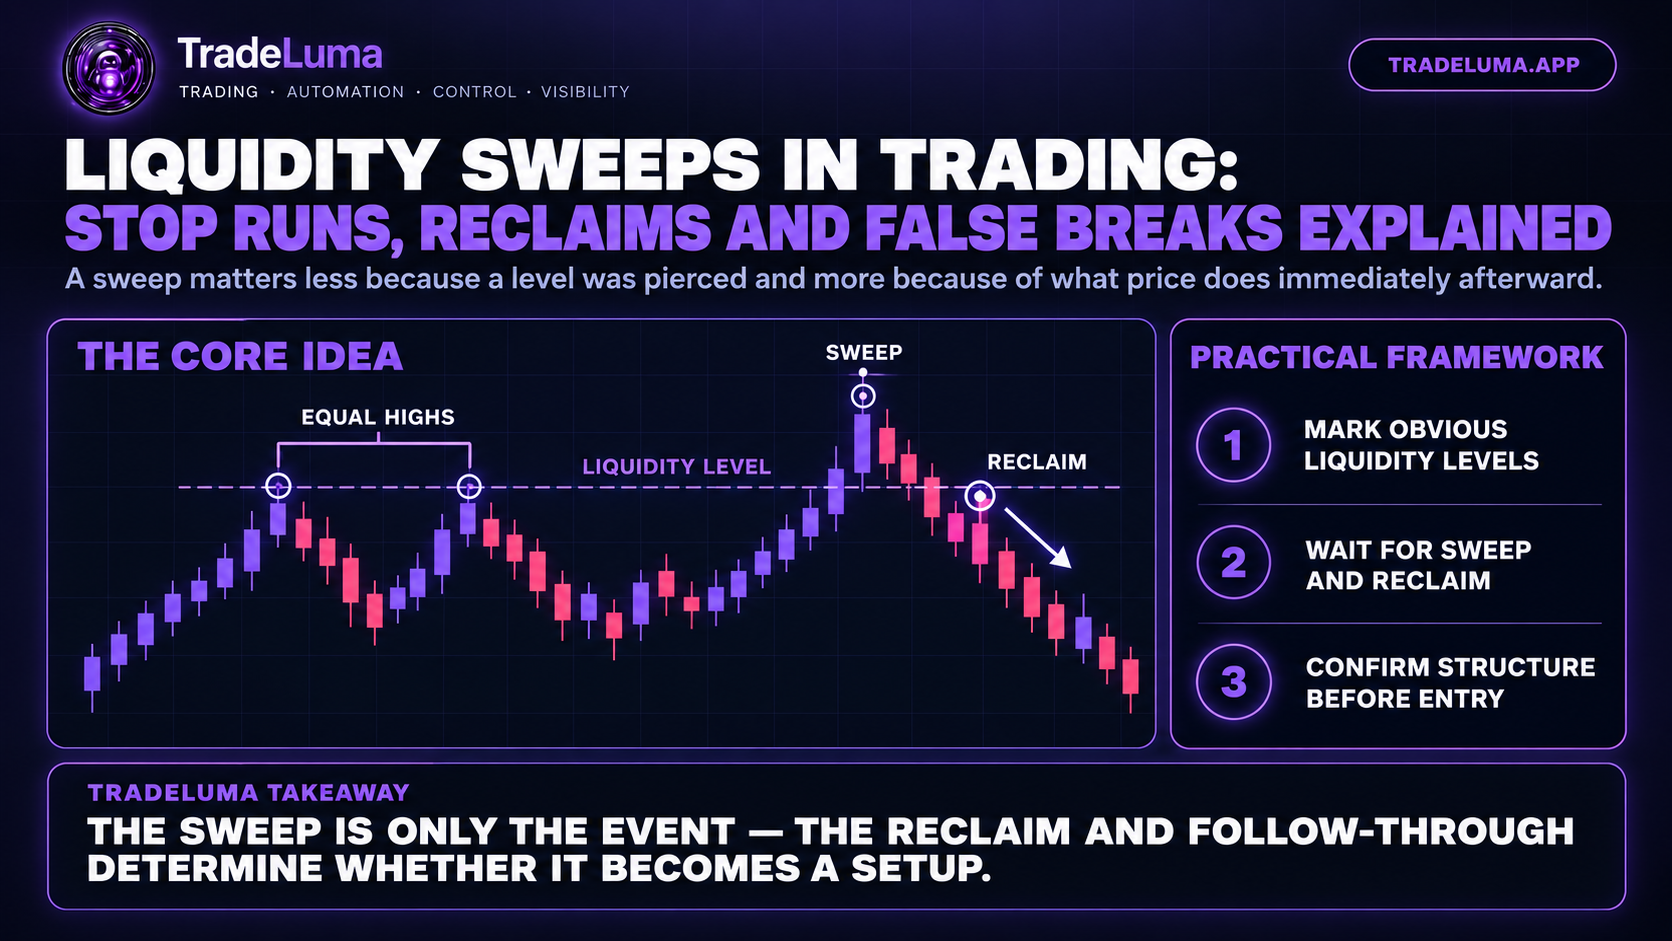
Learn how traders identify liquidity sweeps around obvious highs and lows, distinguish them from breakouts, and combine reclaims with structure and risk.
Full library
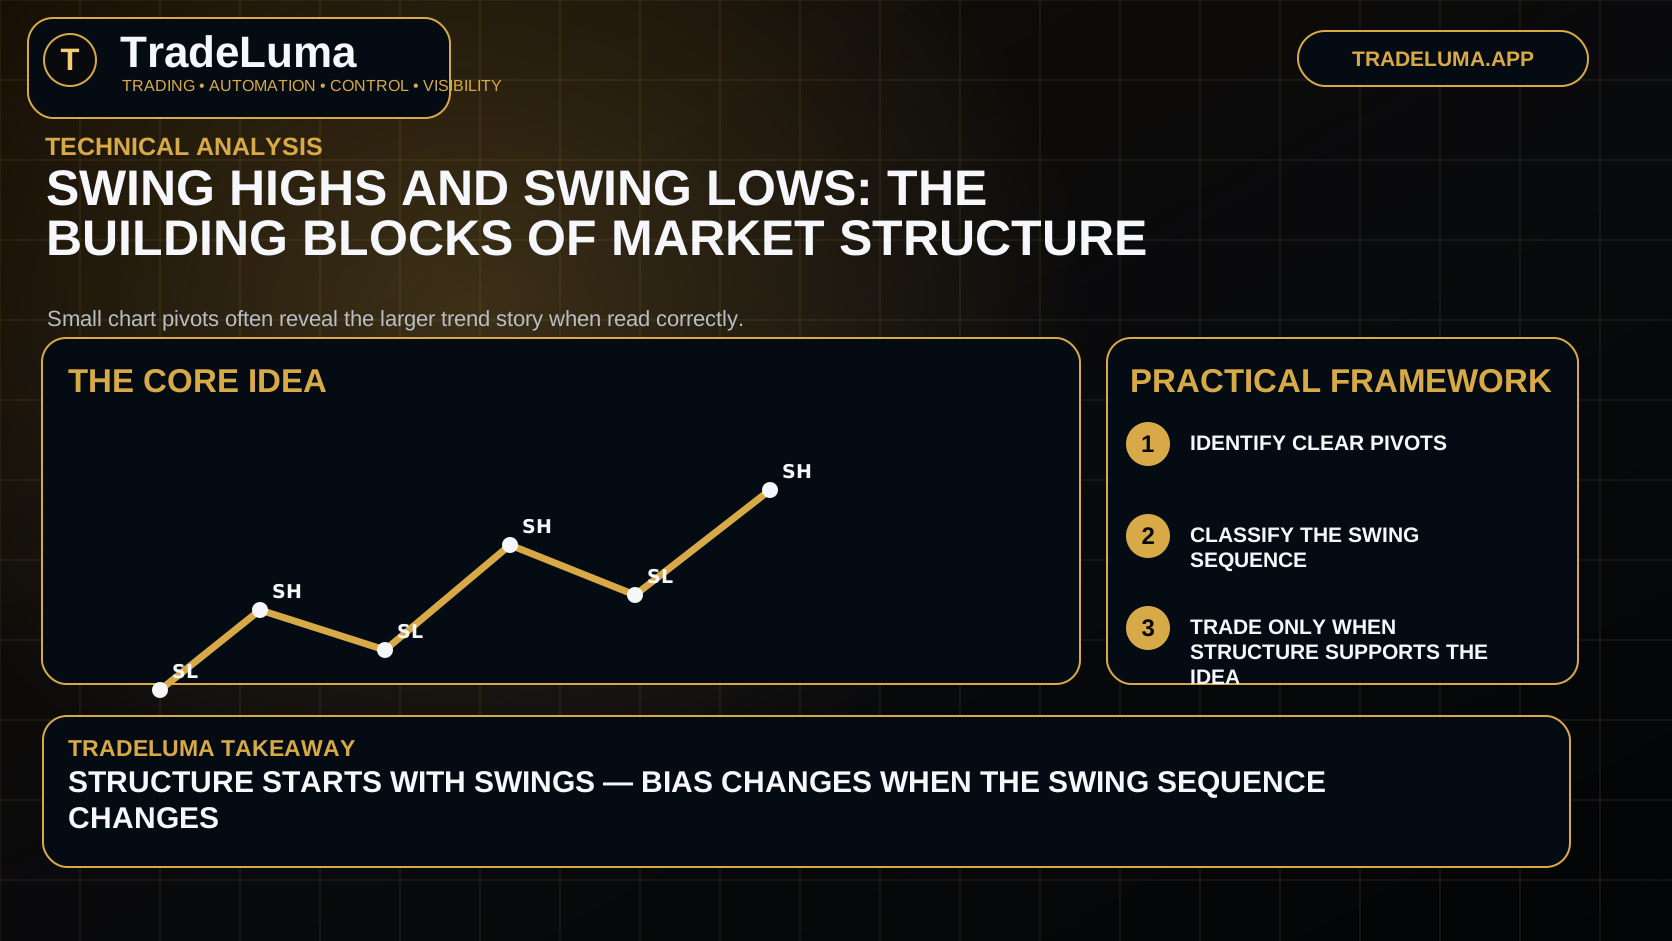
Understand swing highs and swing lows, why they matter for market structure, and how traders use them to frame trend, entries, and invalidation.
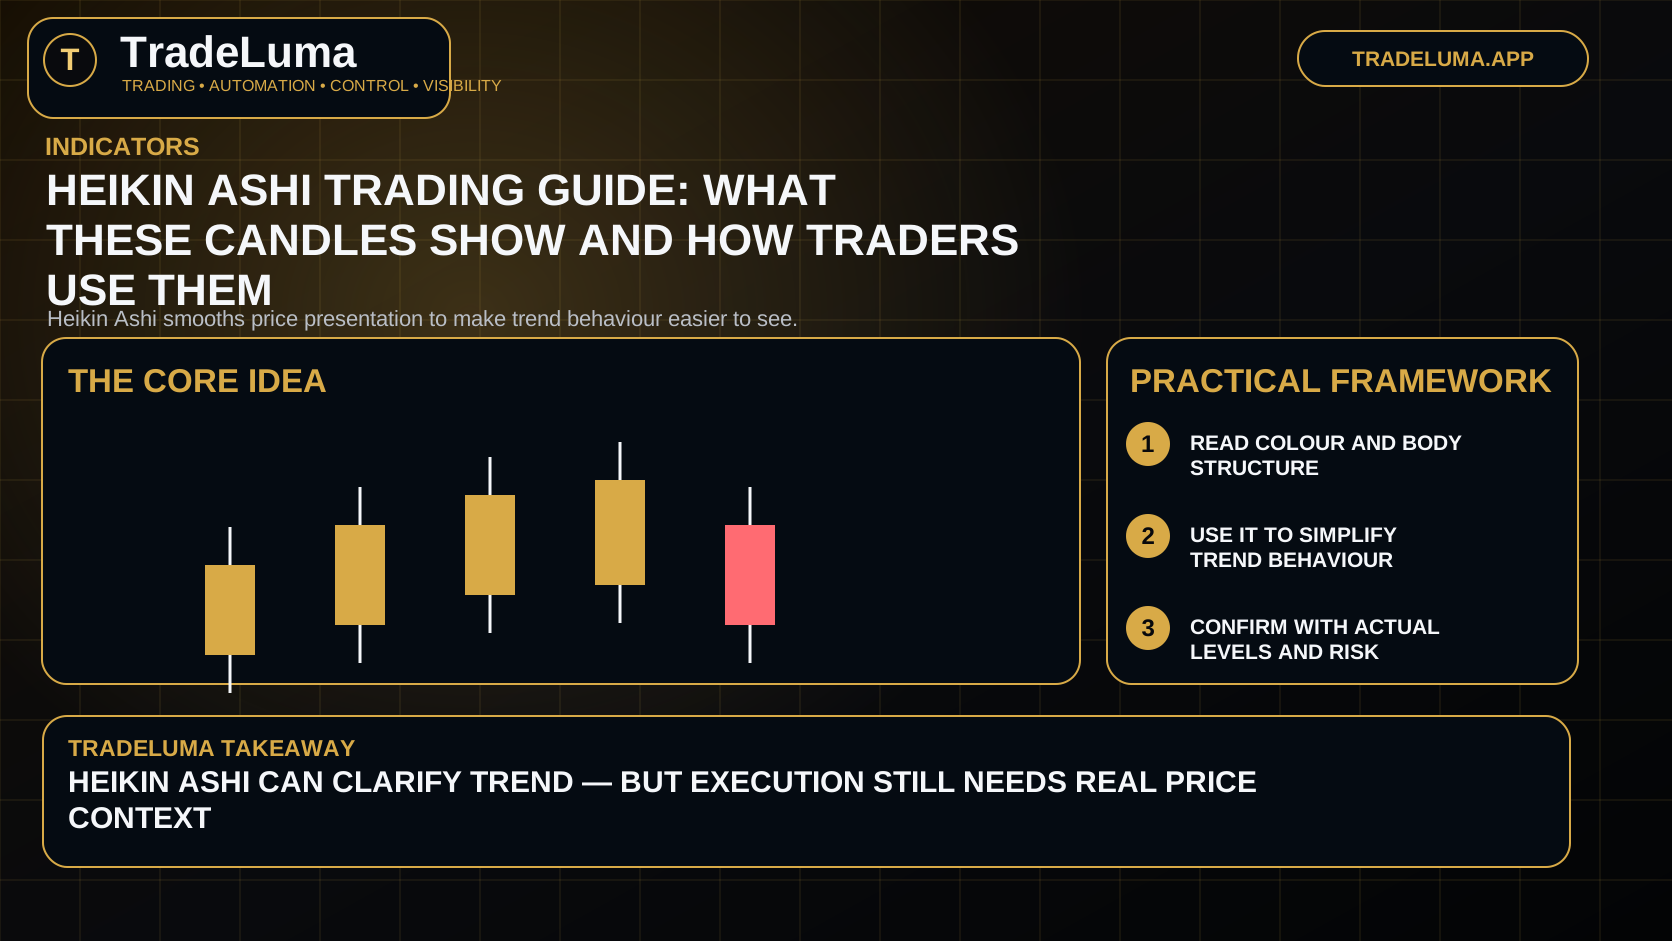
A practical guide to Heikin Ashi candles, how they differ from standard candlesticks, and when traders use them to simplify trend reading.
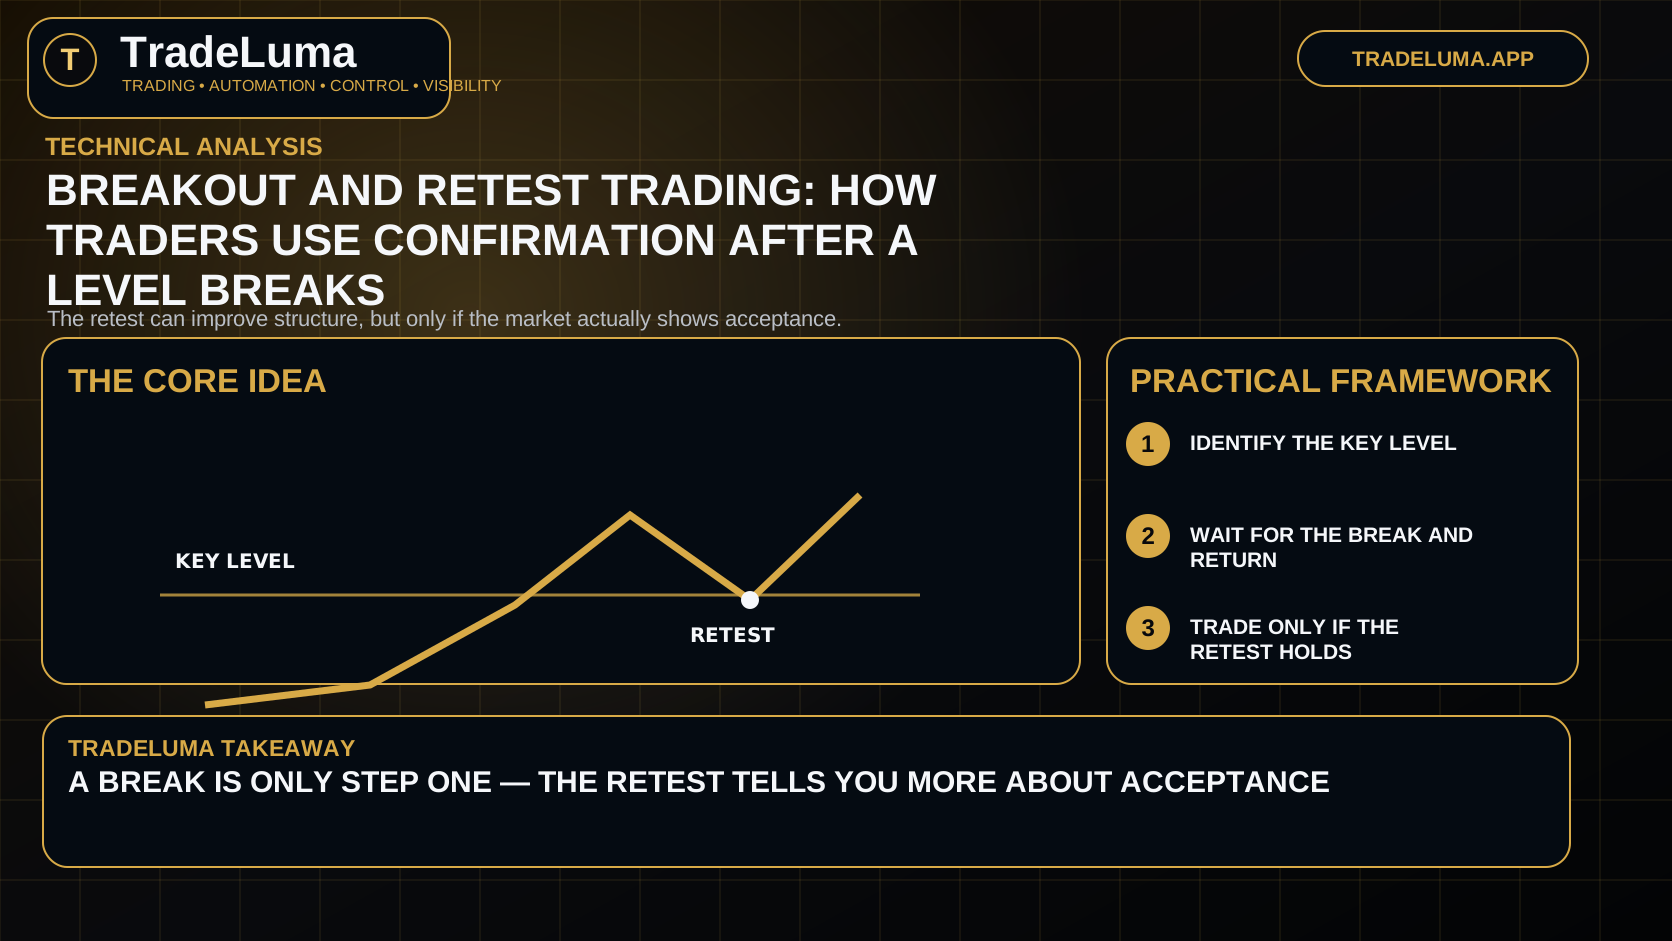
Learn what a breakout and retest setup is, why many traders prefer it, and how to avoid confusing every pullback with confirmation.
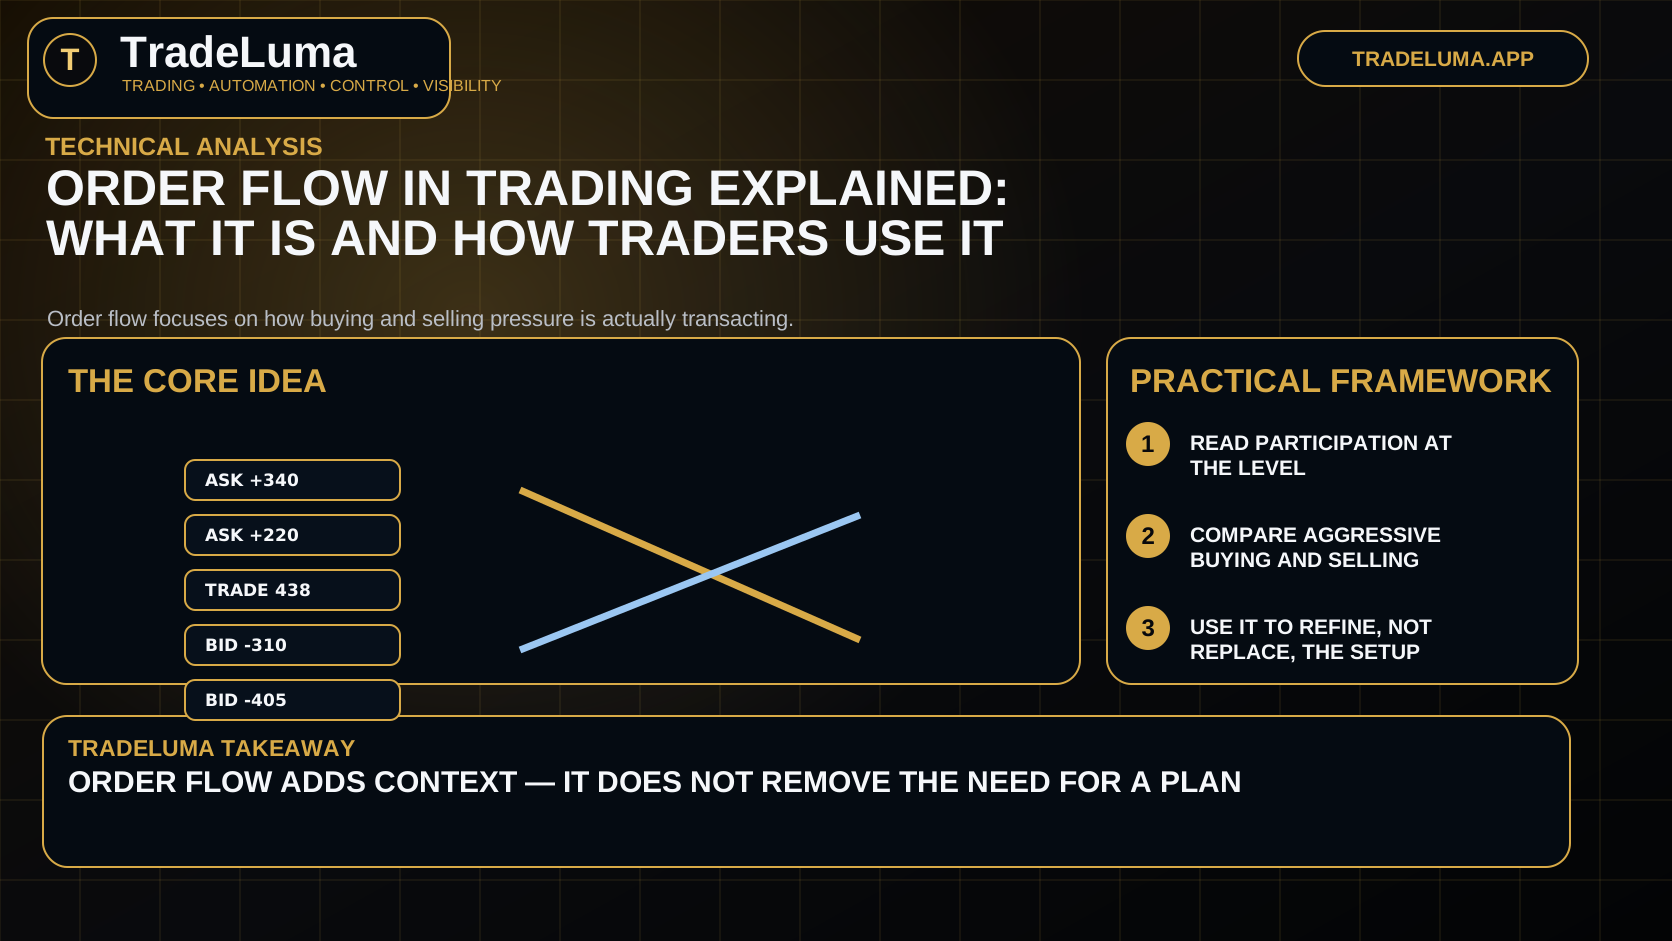
A practical guide to order flow, bid and ask activity, and how traders use execution information to add context to chart-based decisions.
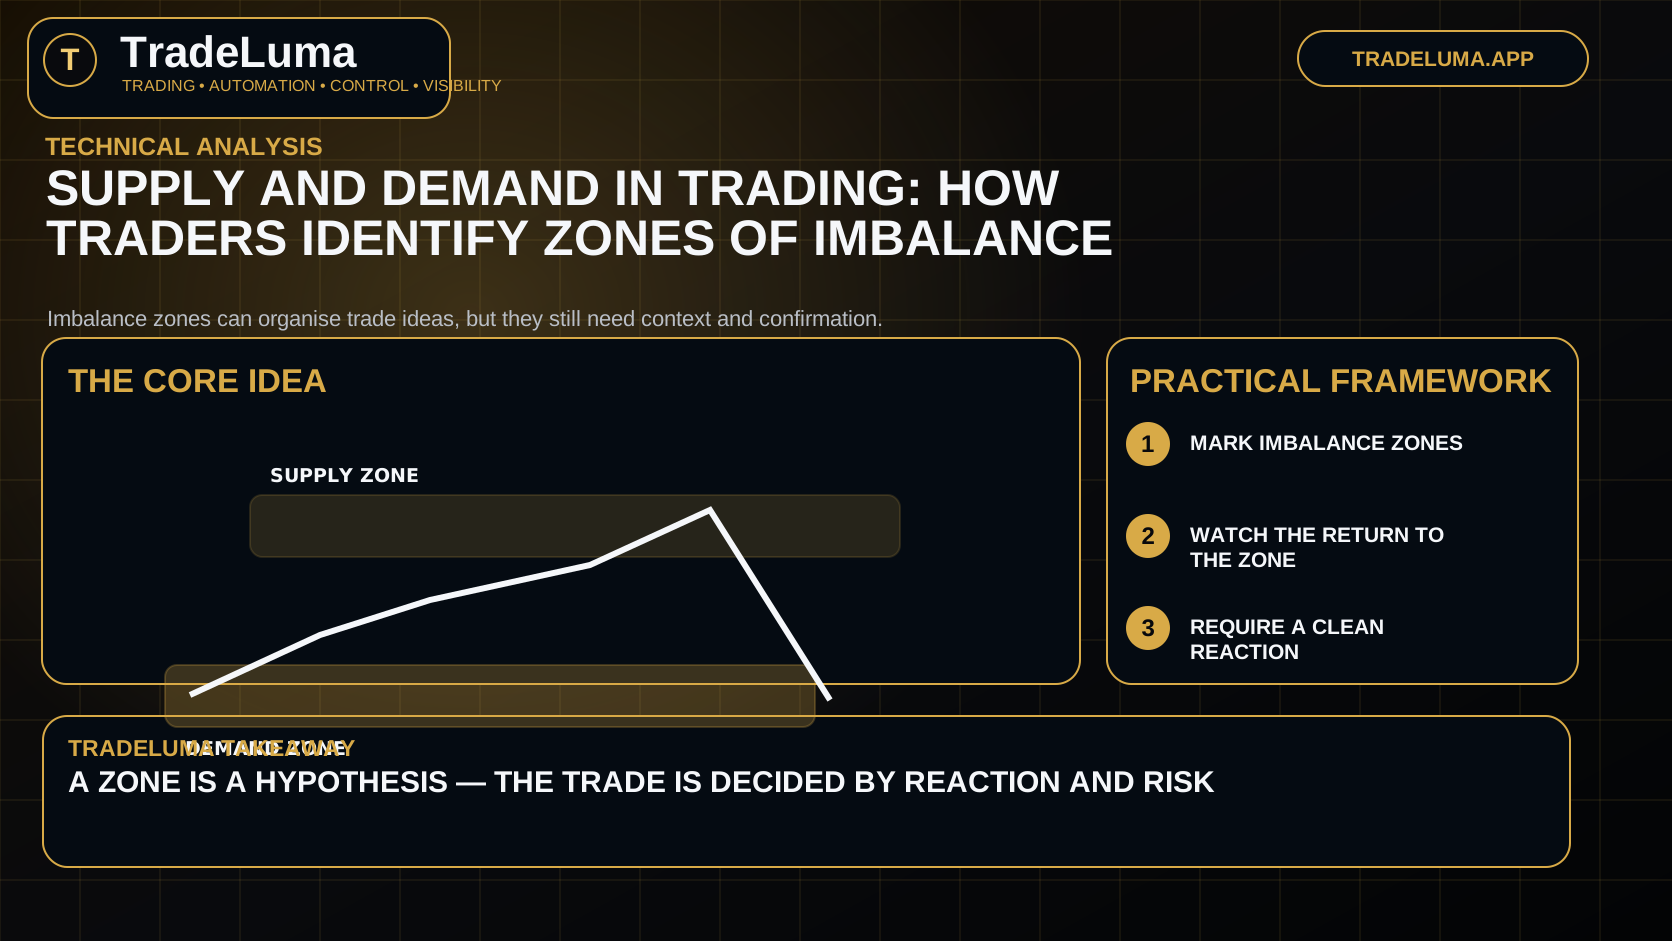
Learn what supply and demand zones are, how traders identify them, and how to use them alongside structure, timing, and risk control.
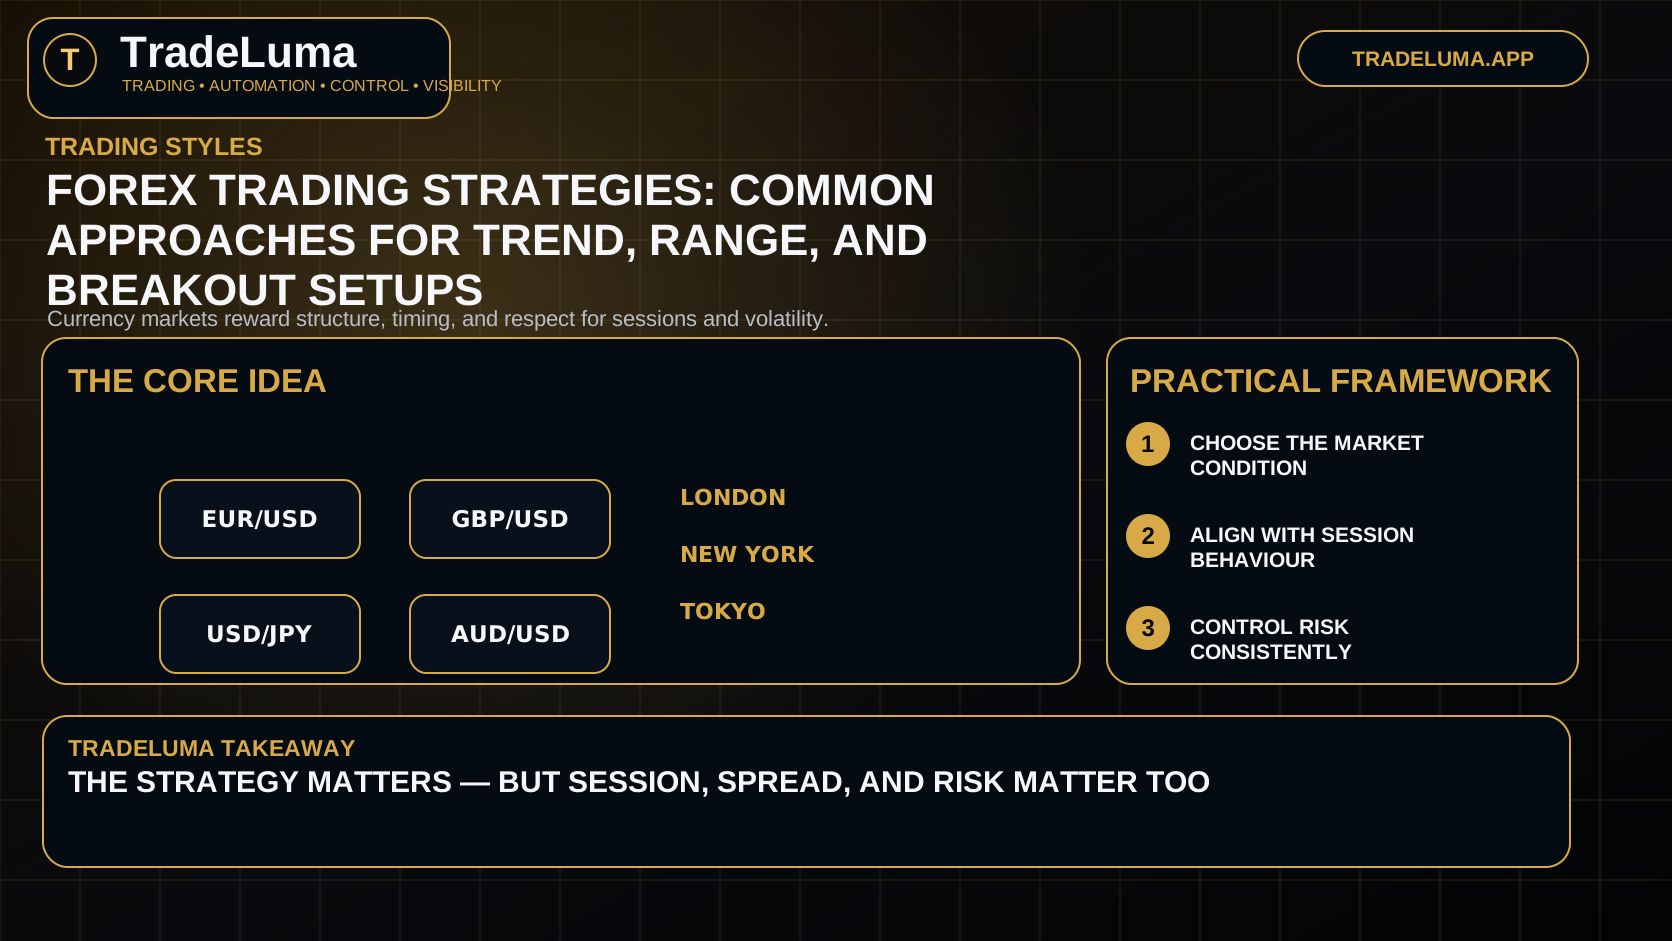
A practical guide to forex trading strategies, including trend following, range trading, breakouts, and the role of sessions, volatility, and risk control.
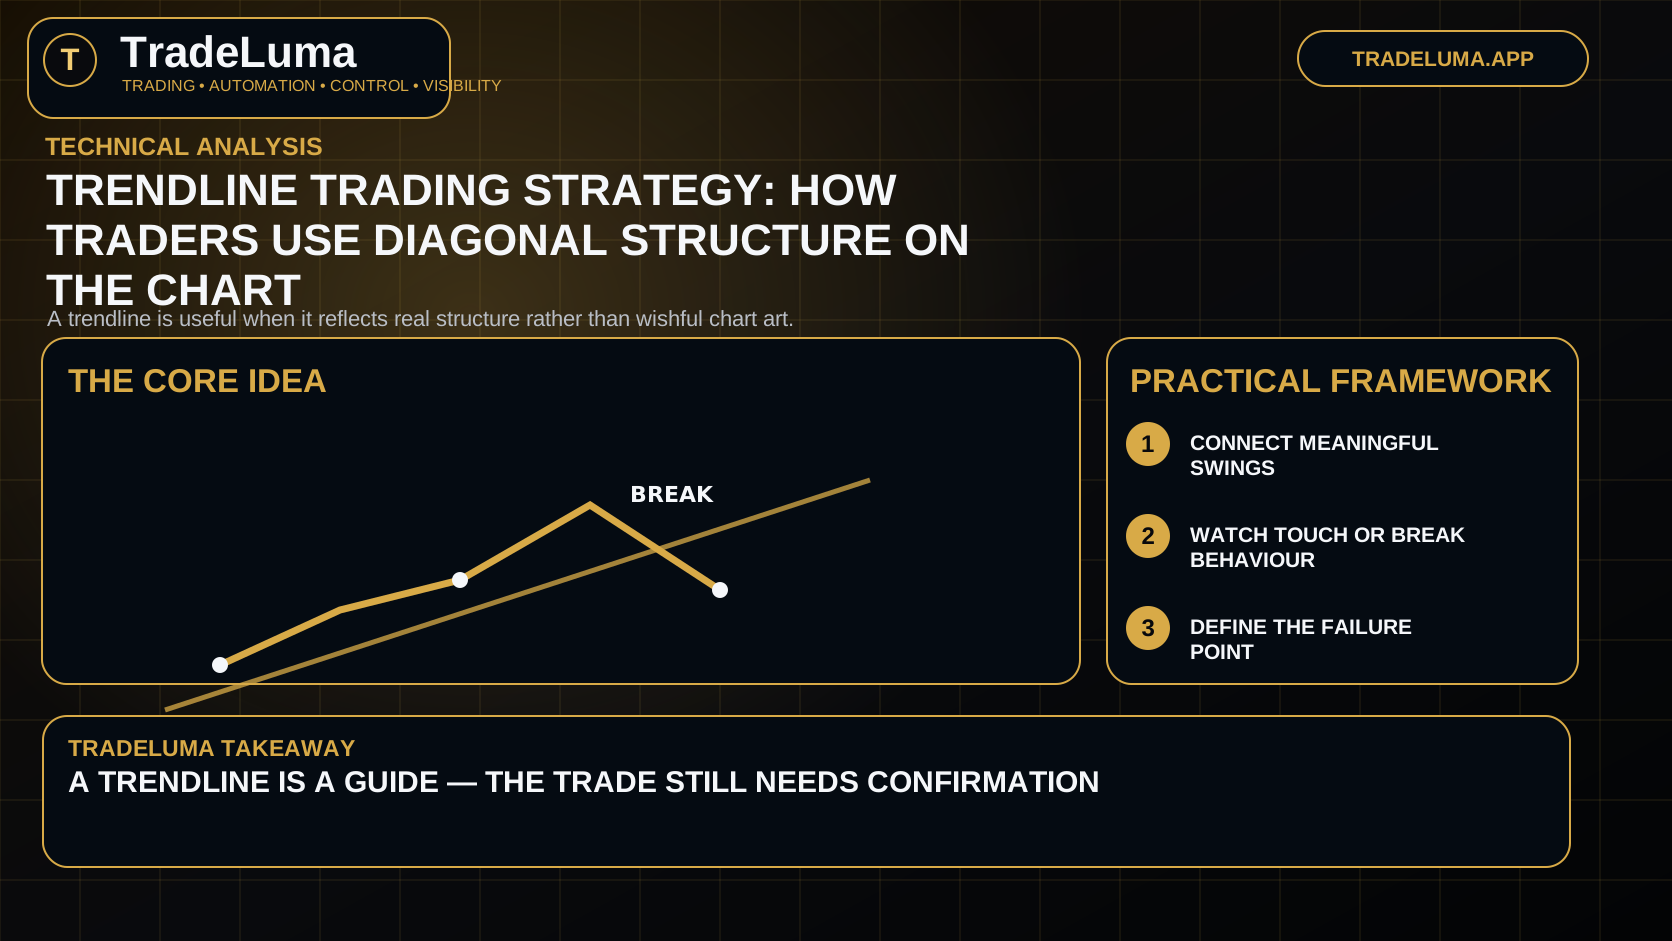
Learn how trendlines are drawn, what they can and cannot do, and how to use them with structure, entries, and invalidation.
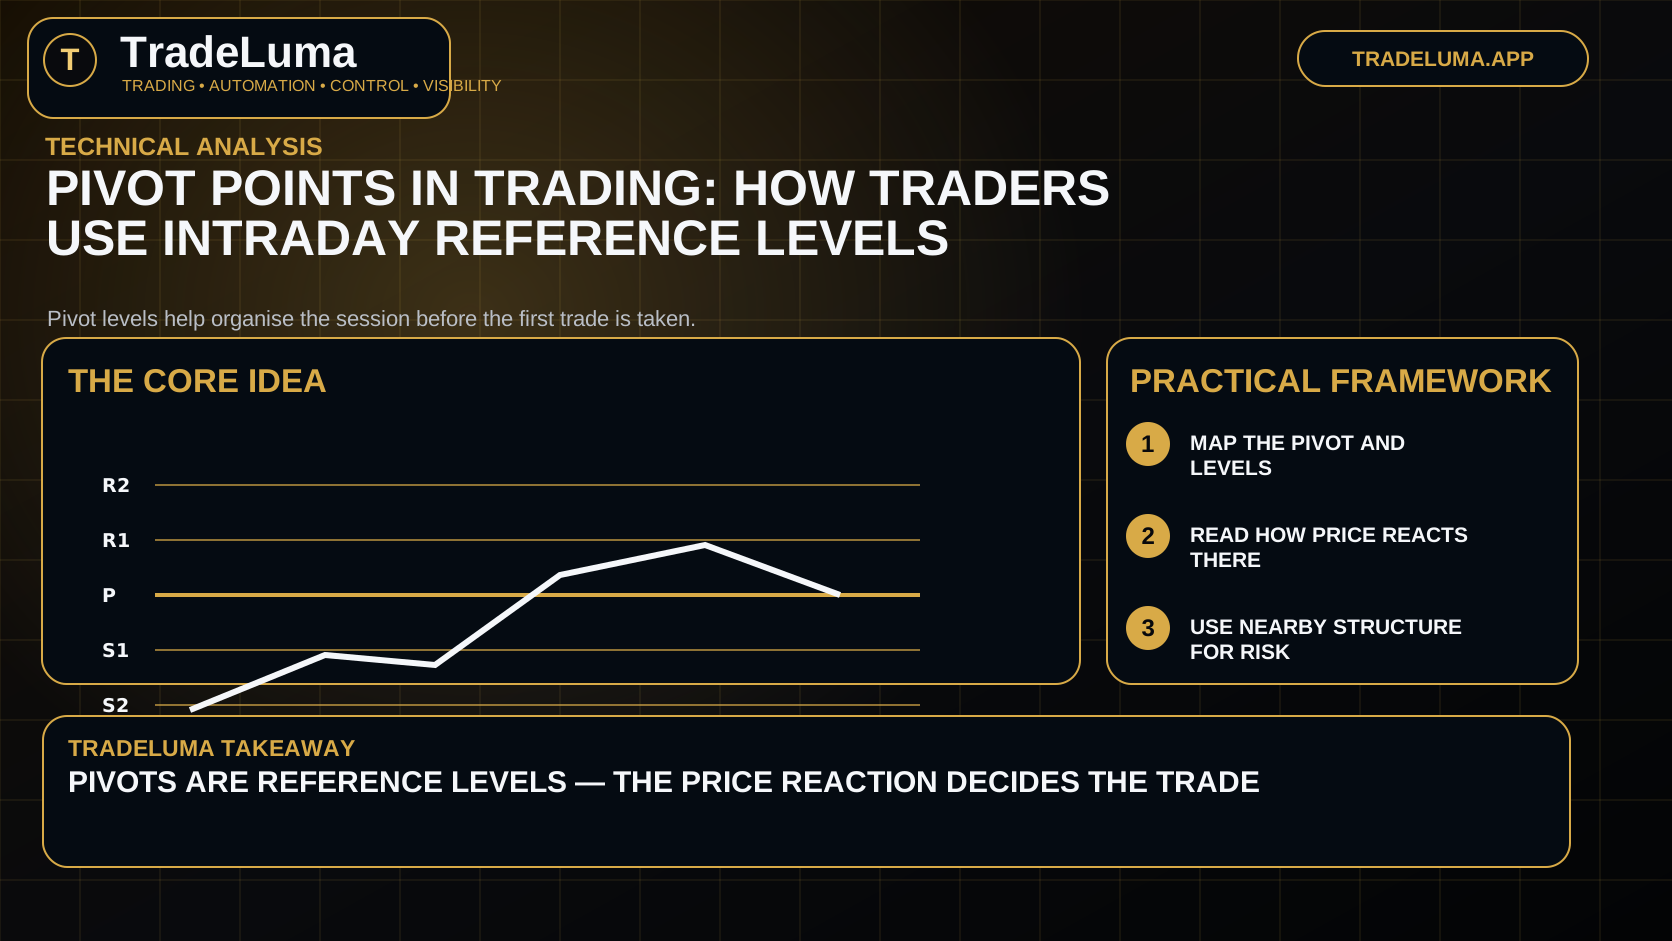
Learn what pivot points are, how they are calculated, and how day traders use them as reference levels for bias, reactions, and trade planning.
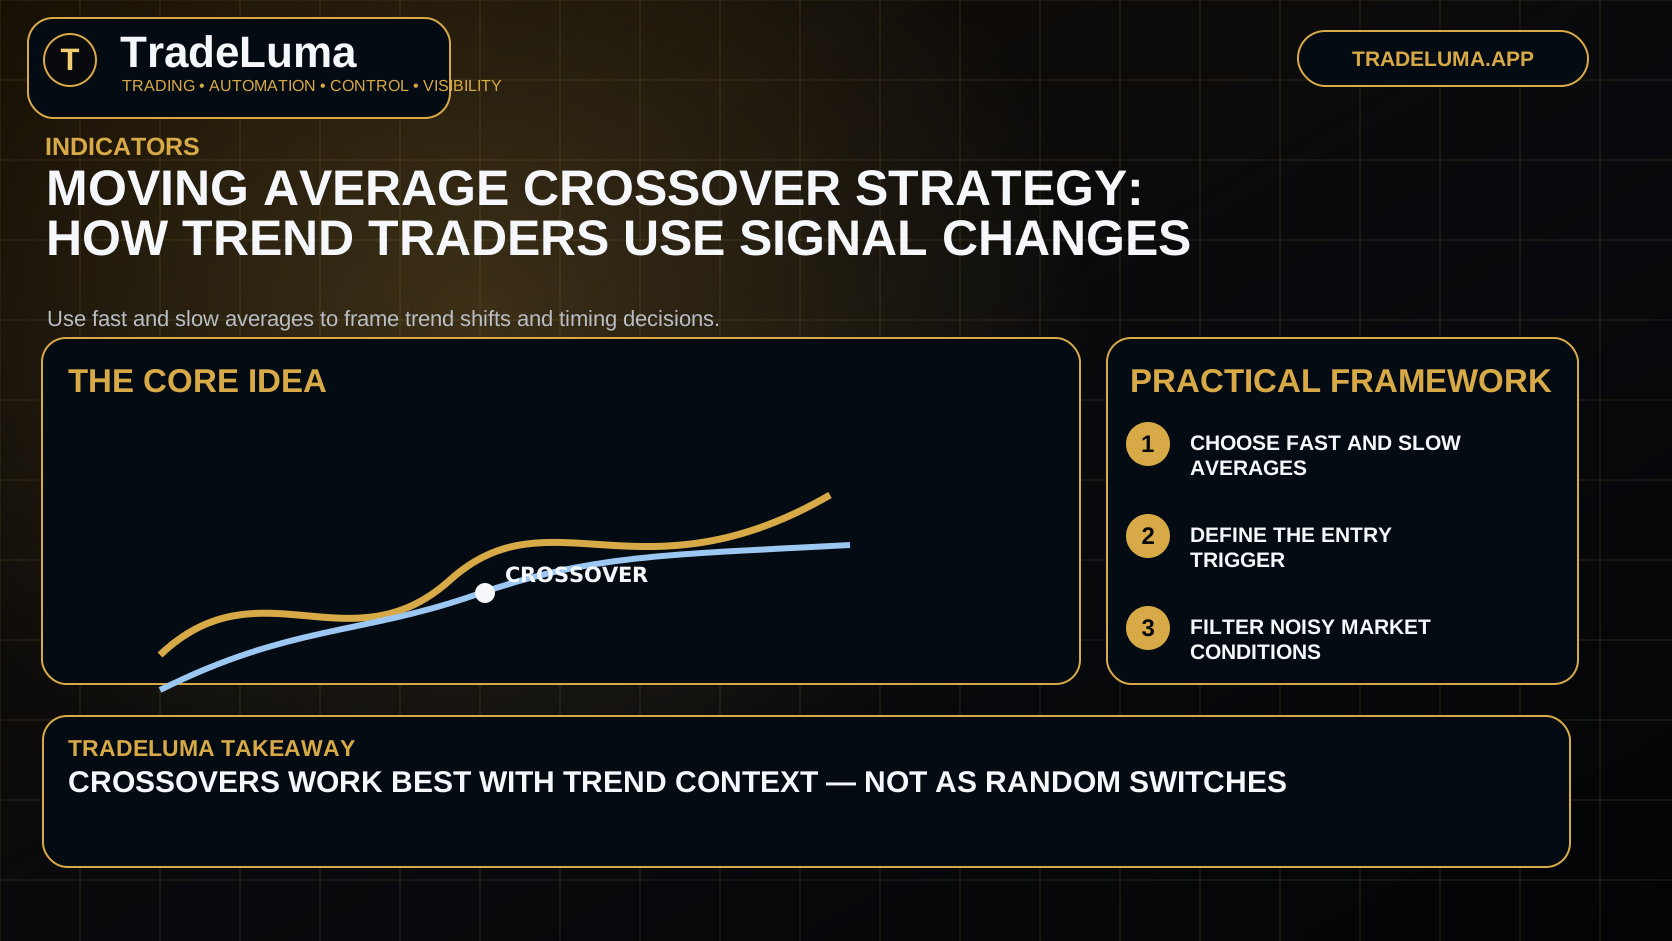
Learn how moving average crossover strategies work, what the signals mean, and how traders reduce whipsaws with structure and context.
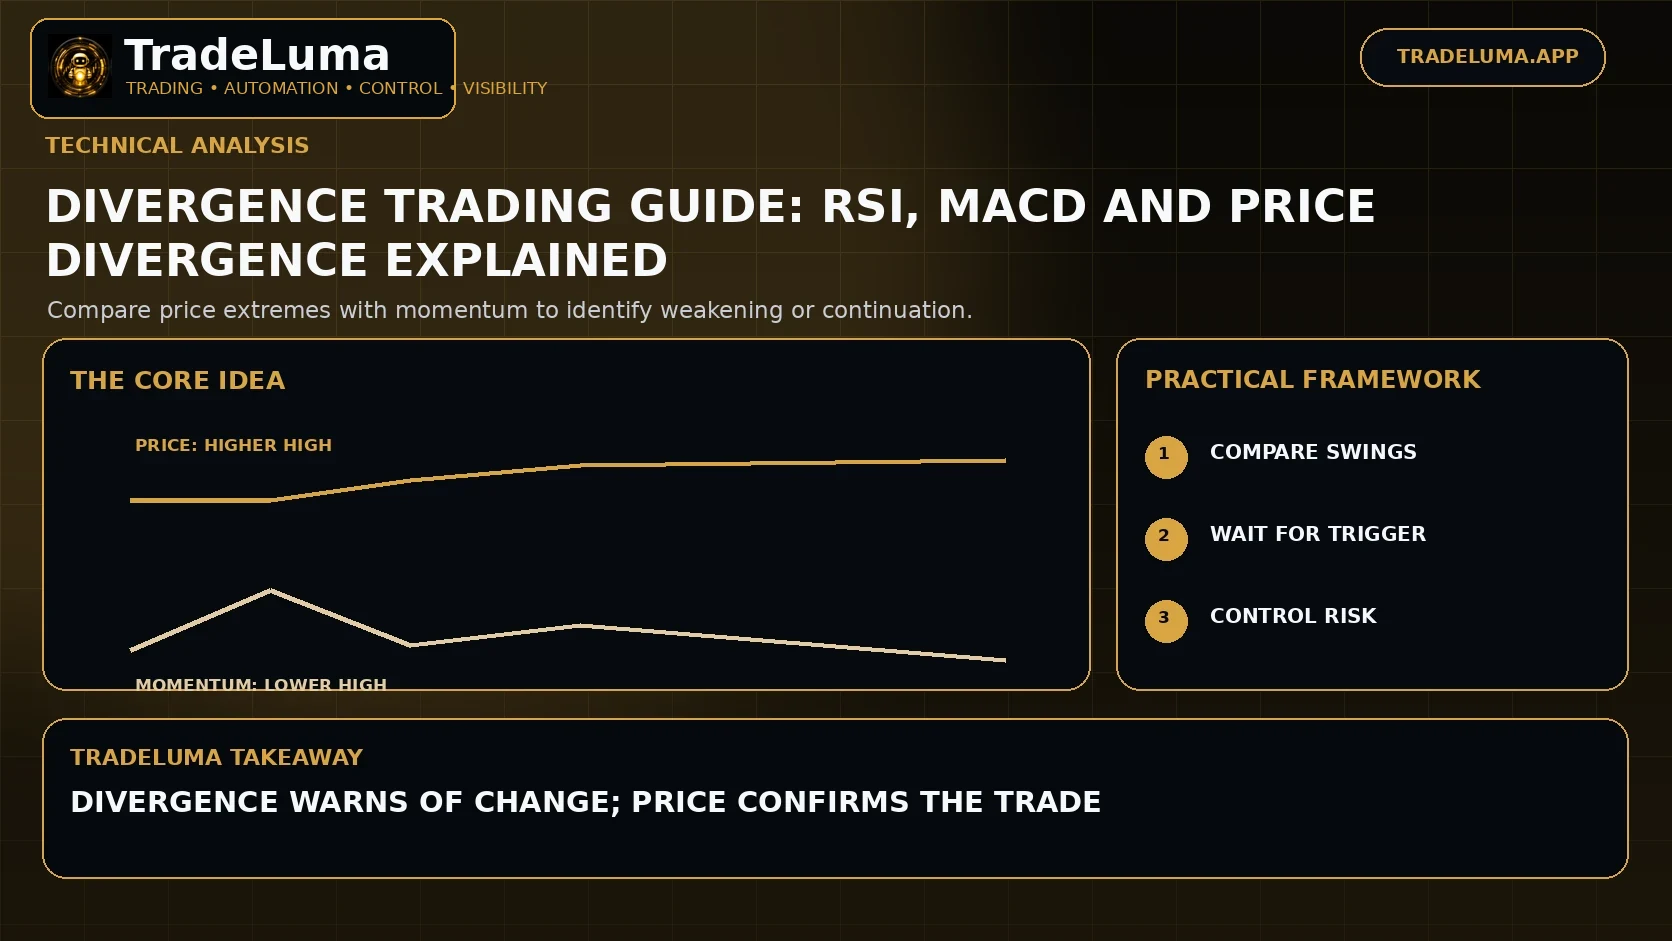
Learn bullish and bearish divergence, hidden divergence, why momentum can diverge from price, and how to use confirmation instead of predicting reversals too early.
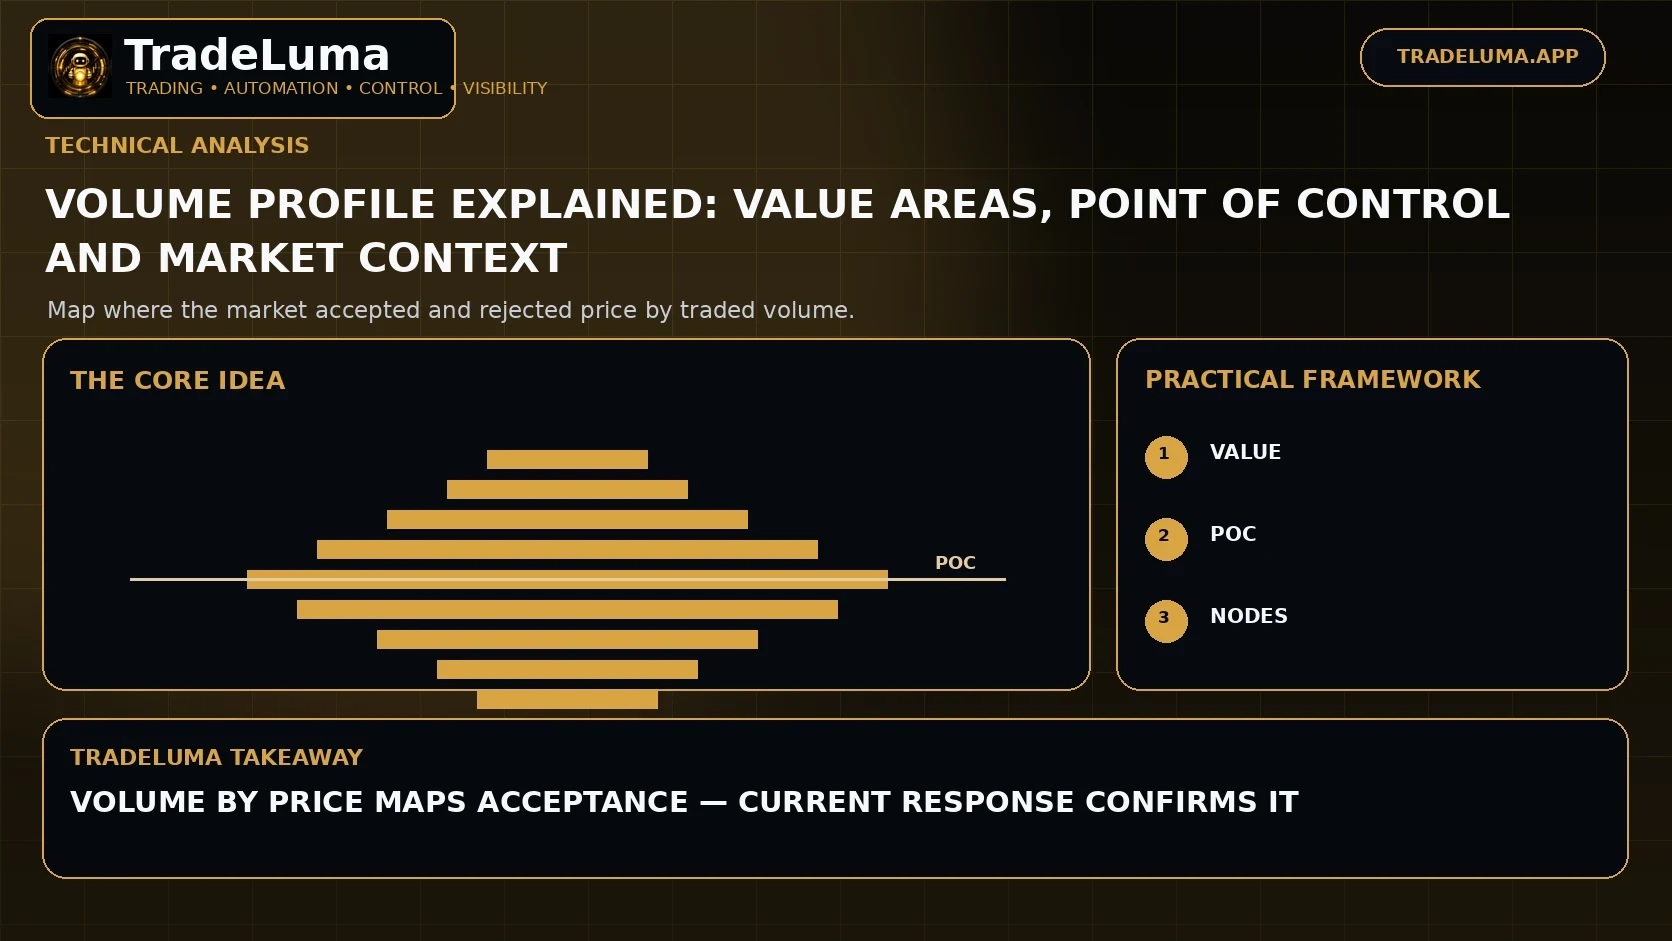
Learn how volume profile distributes traded volume by price, what the point of control and value area mean, and how traders use high- and low-volume nodes.
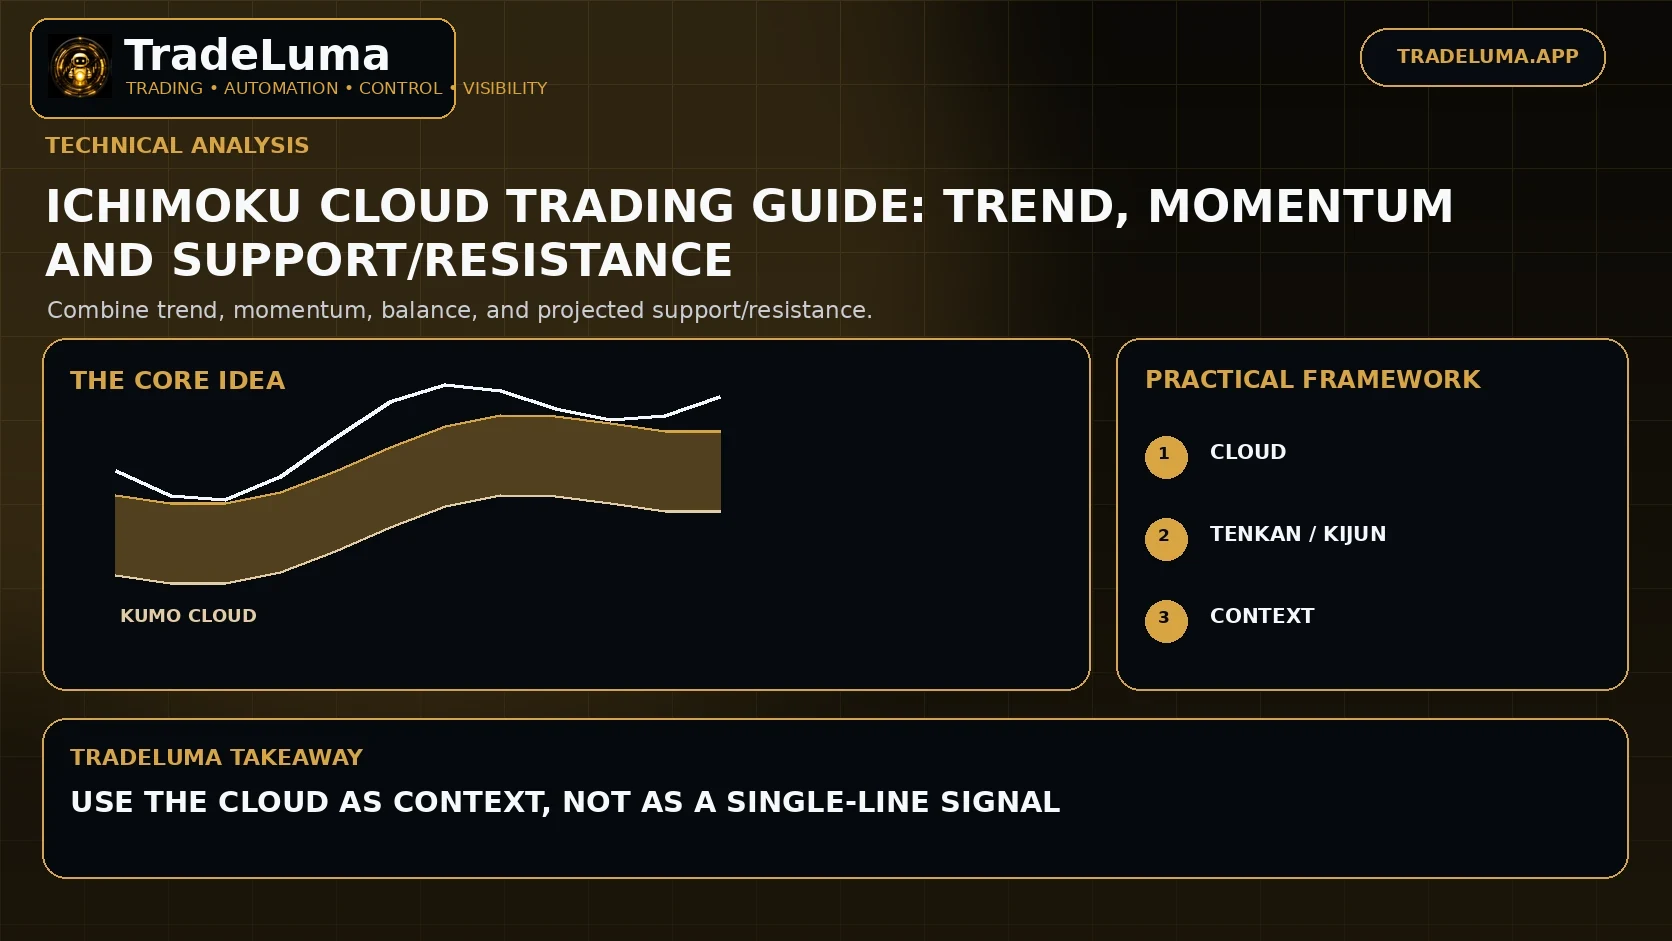
Learn the Ichimoku Cloud components, how traders read trend and momentum, and how Tenkan, Kijun, Senkou spans, and Chikou interact.
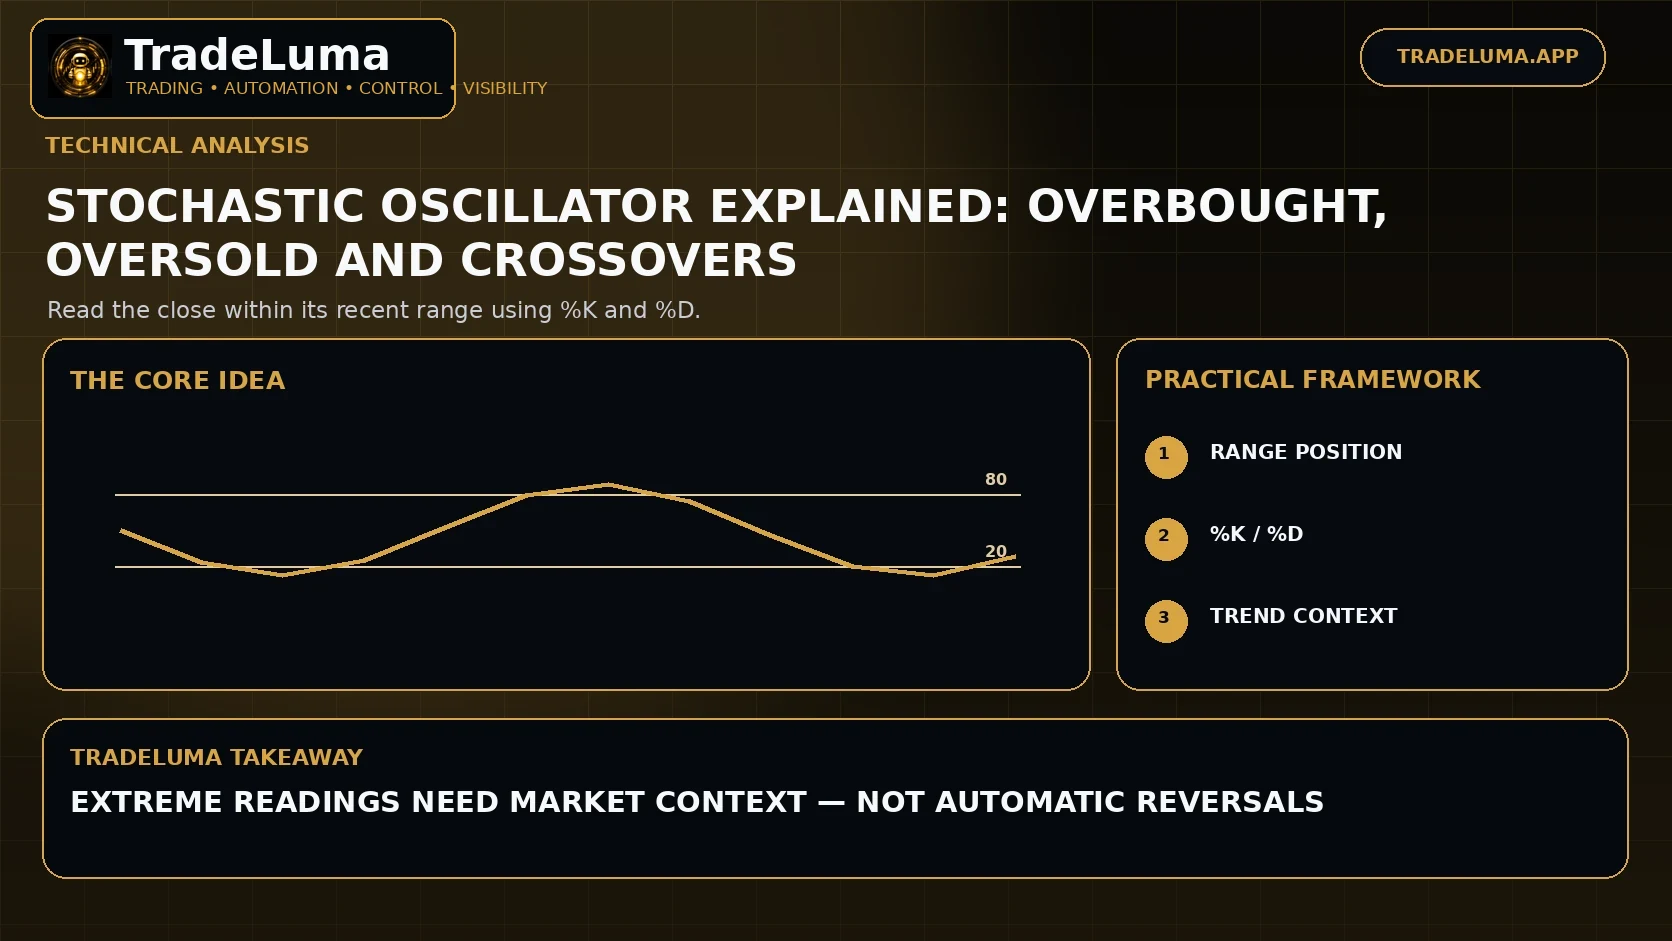
Learn how the stochastic oscillator compares the close with the recent trading range, how %K and %D work, and how traders use it in trends and ranges.
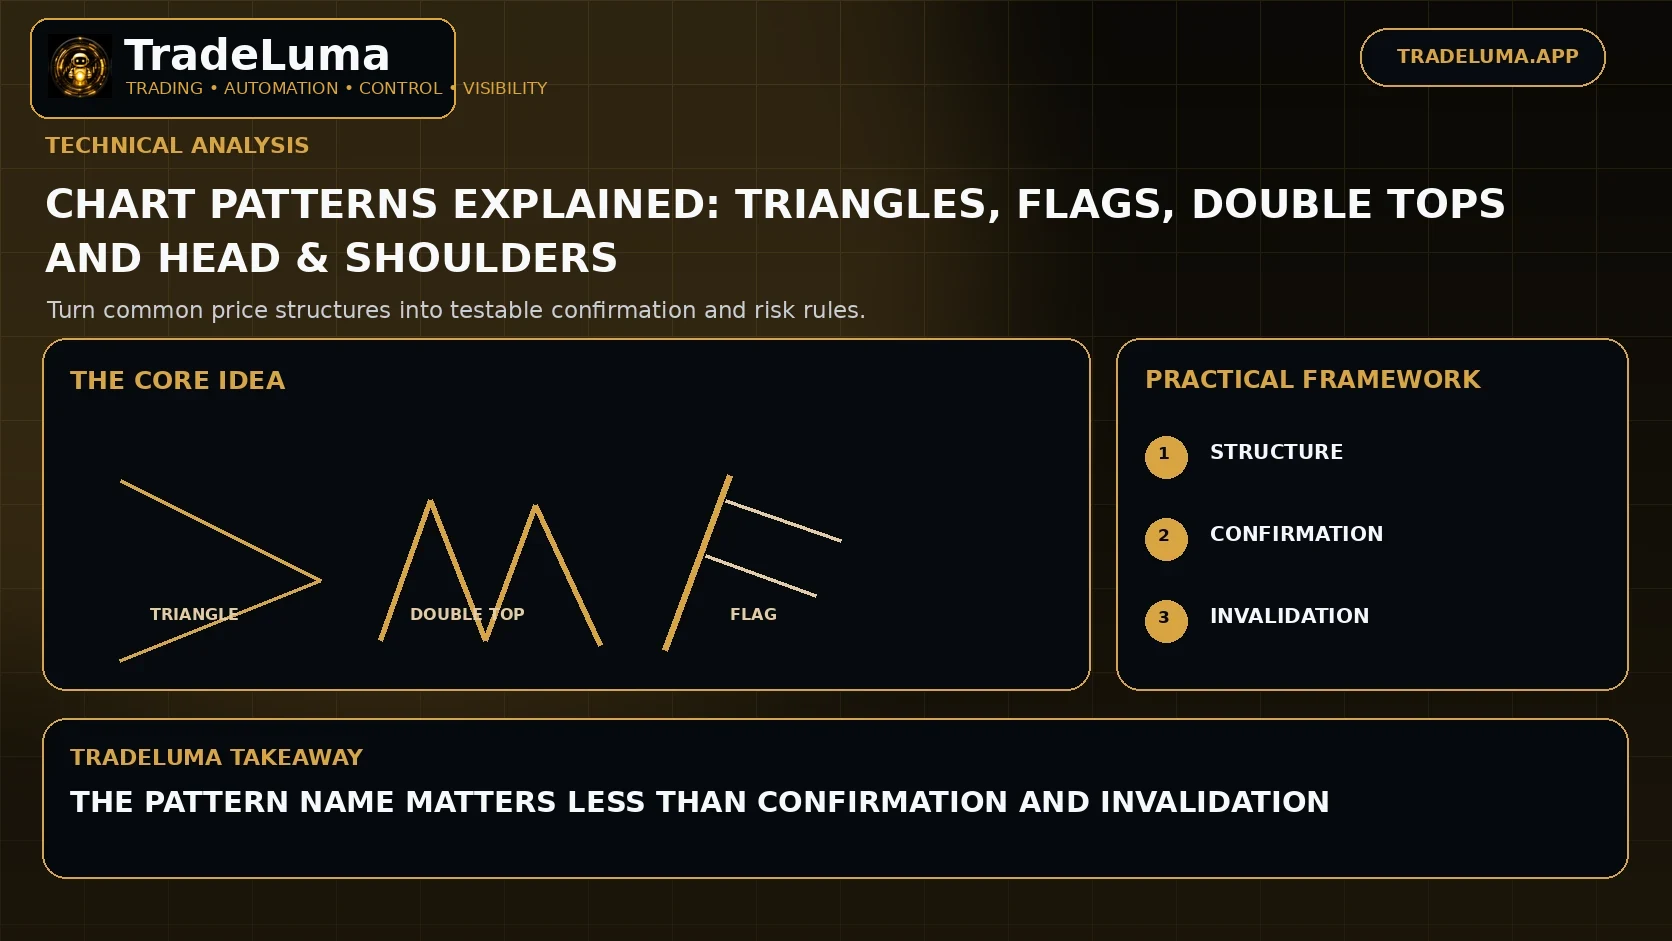
Learn how common chart patterns are formed, what they may imply about price structure, and how traders define confirmation, invalidation, and targets.
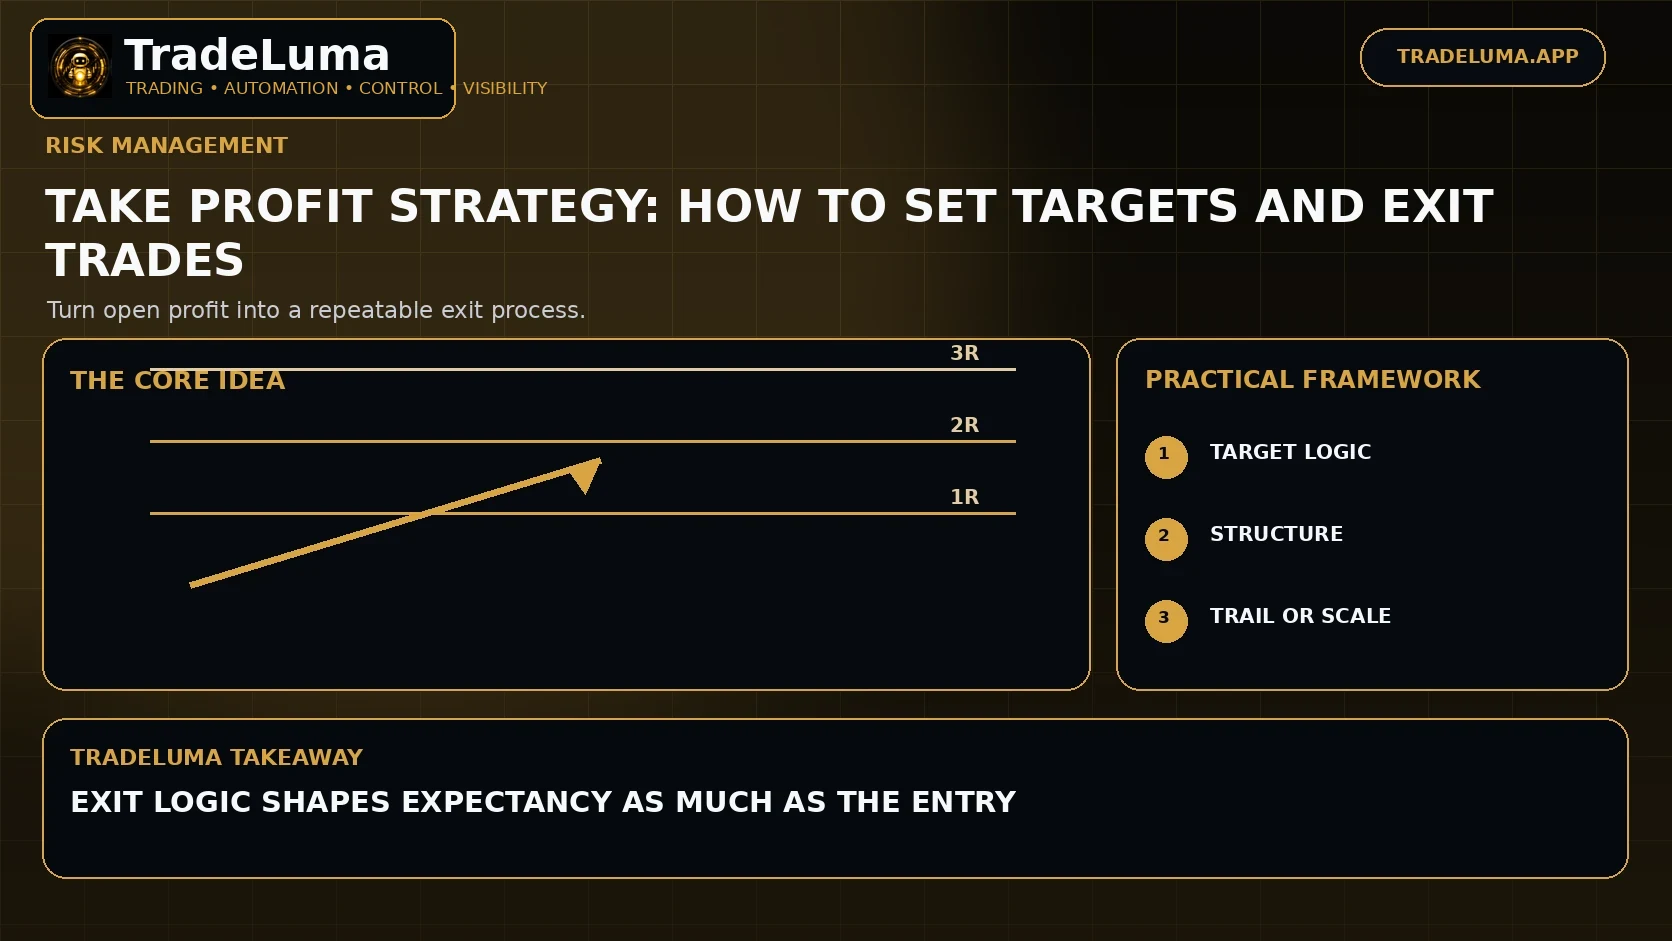
Learn how traders set take-profit targets using reward-to-risk, market structure, volatility, trailing exits, and partial profit-taking.
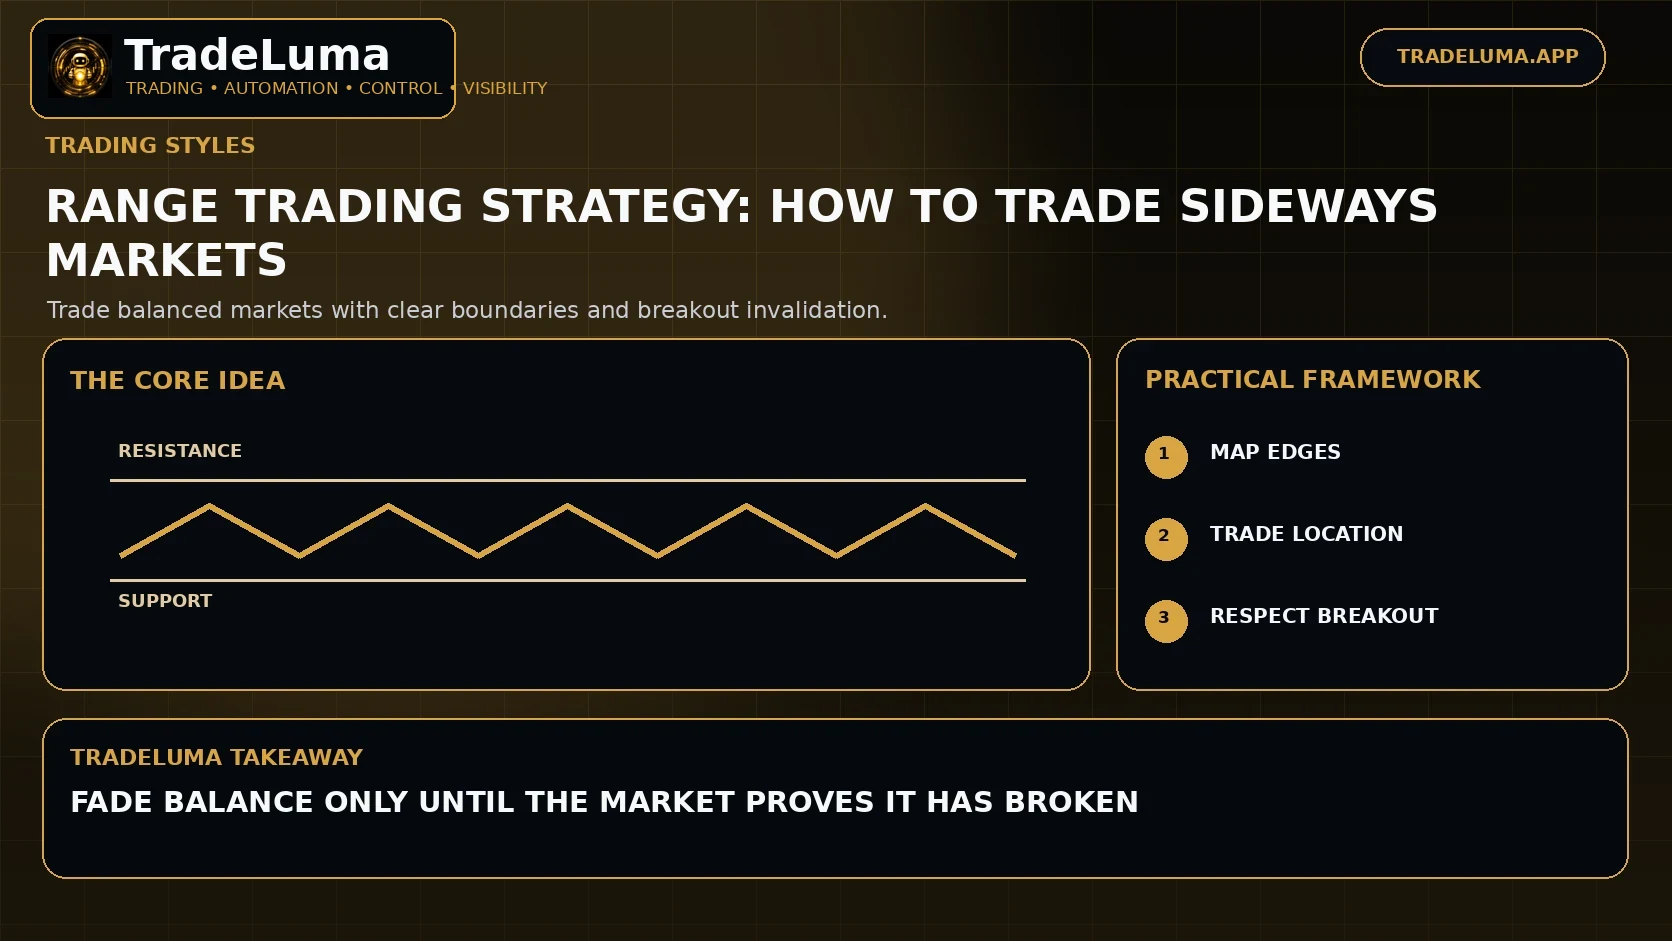
Learn how range trading identifies support, resistance, failed breakouts, and mean reversion when markets move sideways instead of trending.
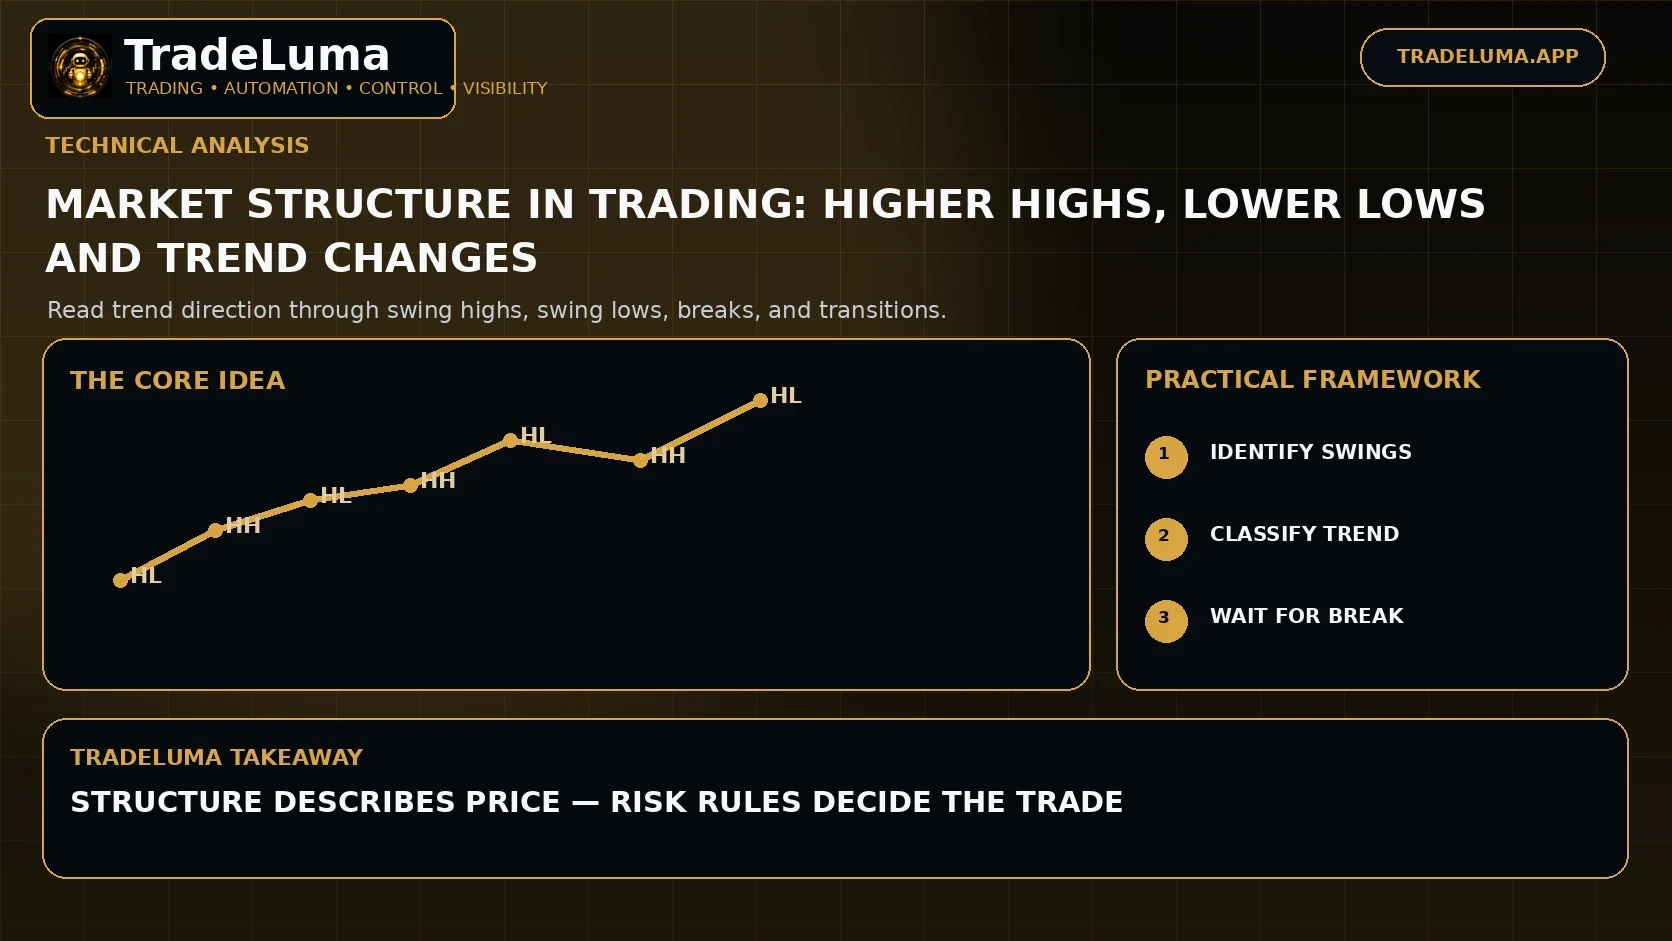
Learn how market structure uses swing highs and lows to describe trends, ranges, breakouts, and possible trend changes without relying on prediction.
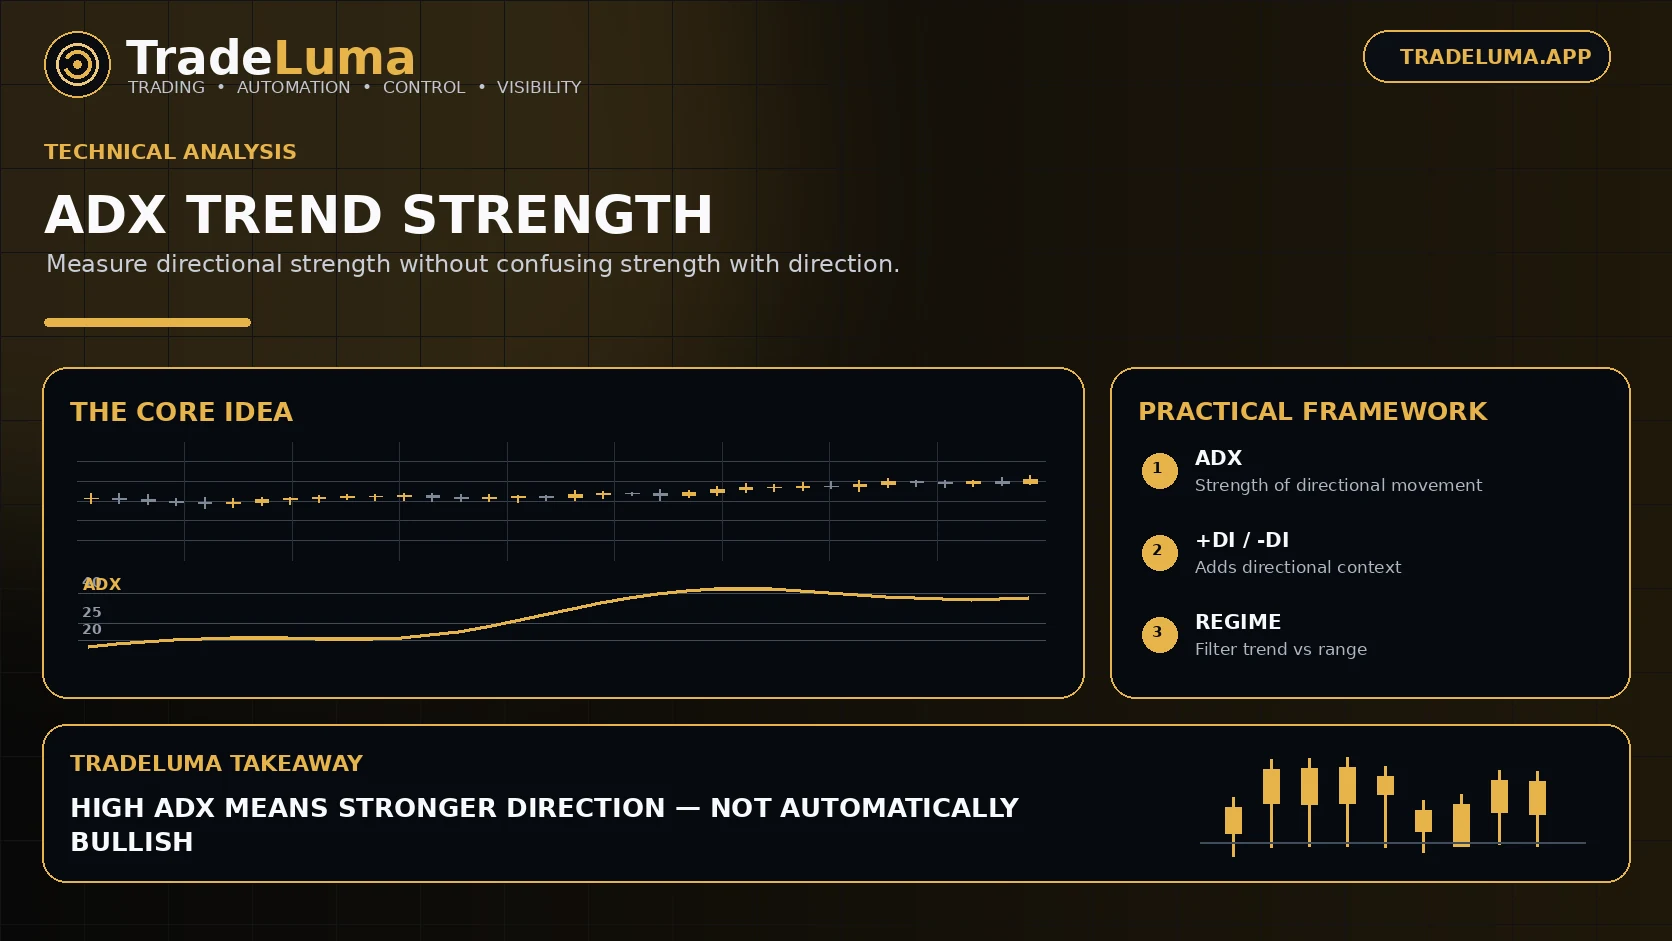
Learn how the Average Directional Index (ADX) measures trend strength, how +DI and -DI add directional context, and how traders use ADX as a filter.
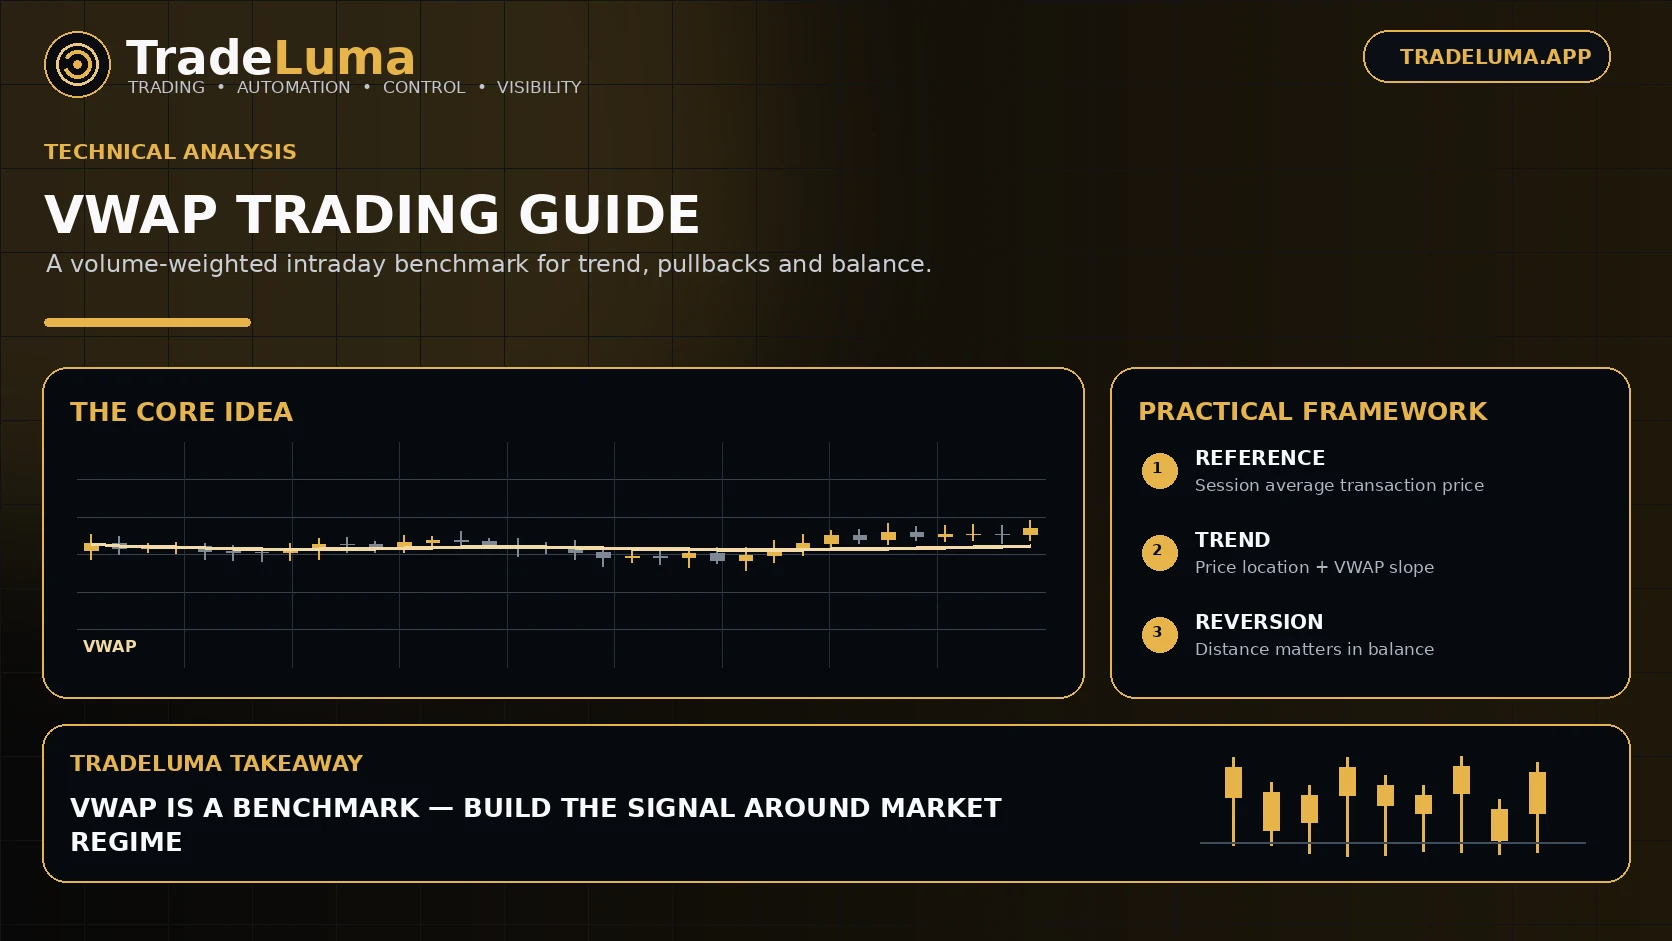
Learn how VWAP works, why intraday traders watch it, and how it can provide context for trend, pullbacks, mean reversion, and execution quality.
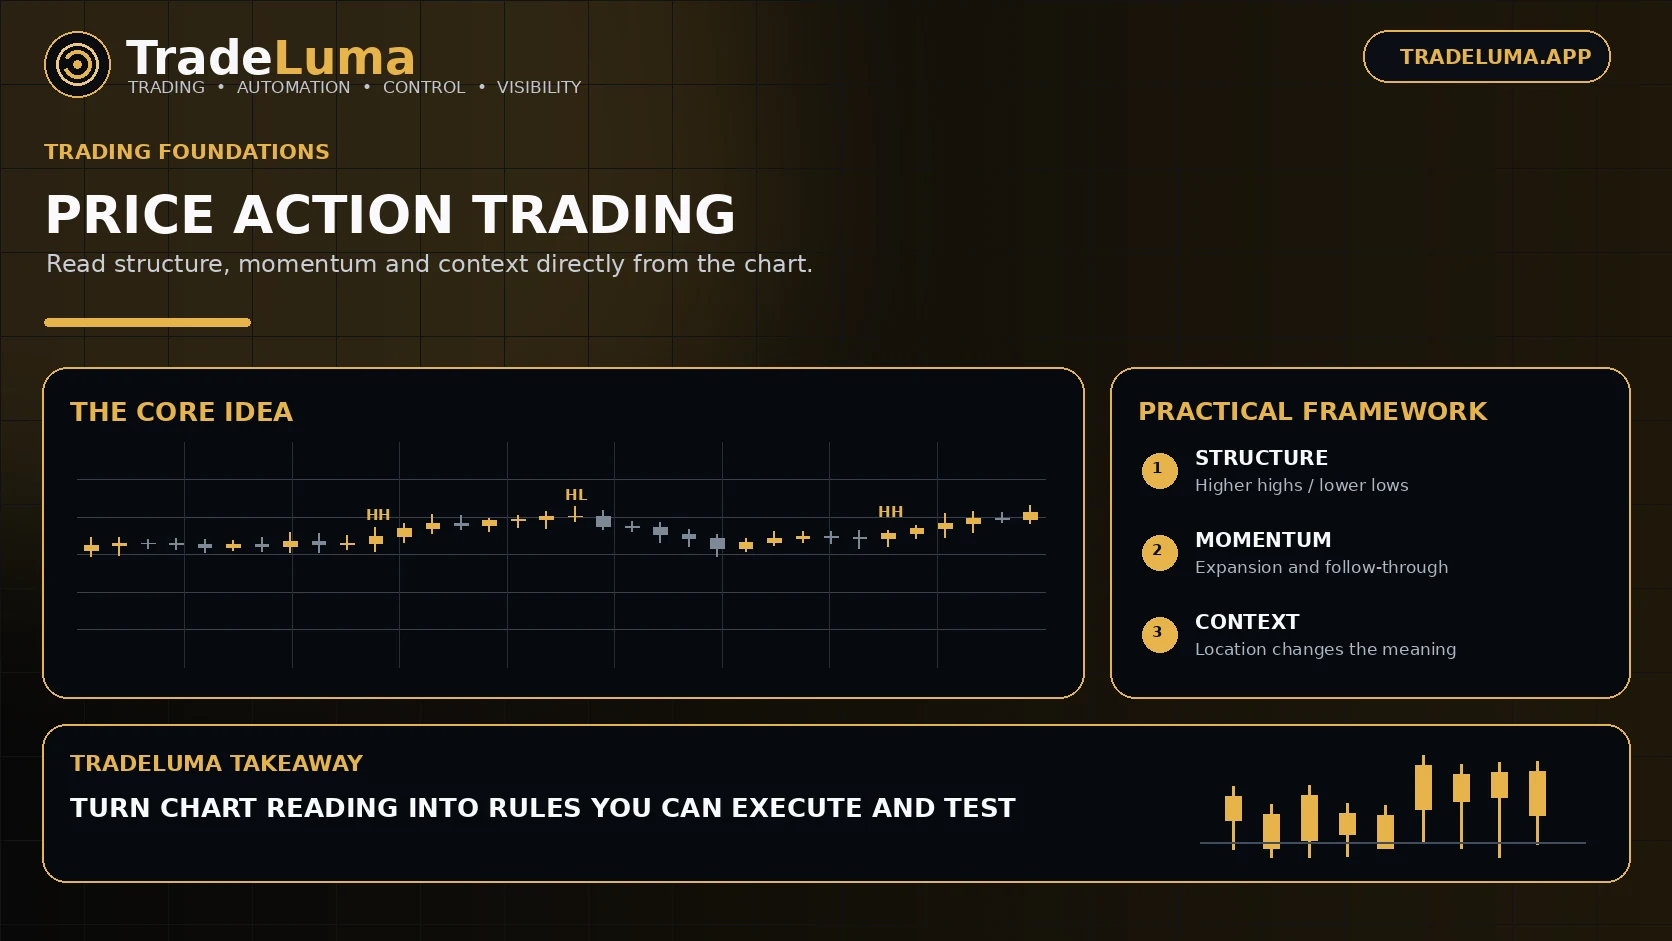
Learn the foundations of price action trading, including swing structure, candles, momentum, ranges, breakouts, pullbacks, and objective rule building.
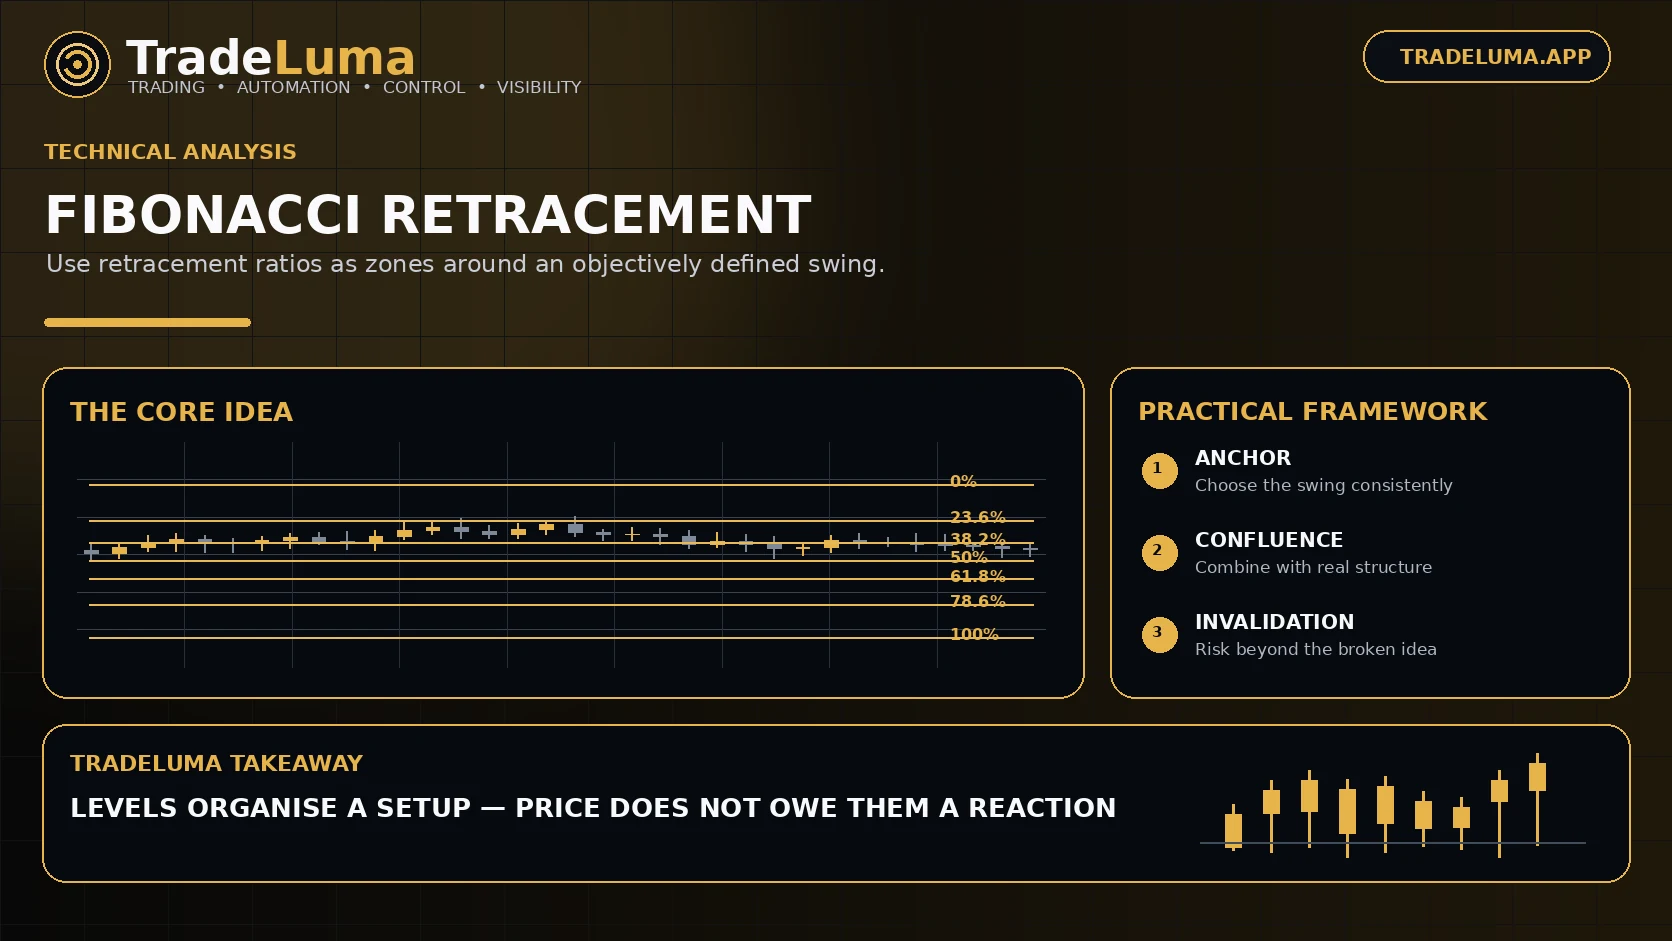
Learn what Fibonacci retracement levels are, how traders anchor them to market swings, and how to combine them with structure, trends, and risk rules.
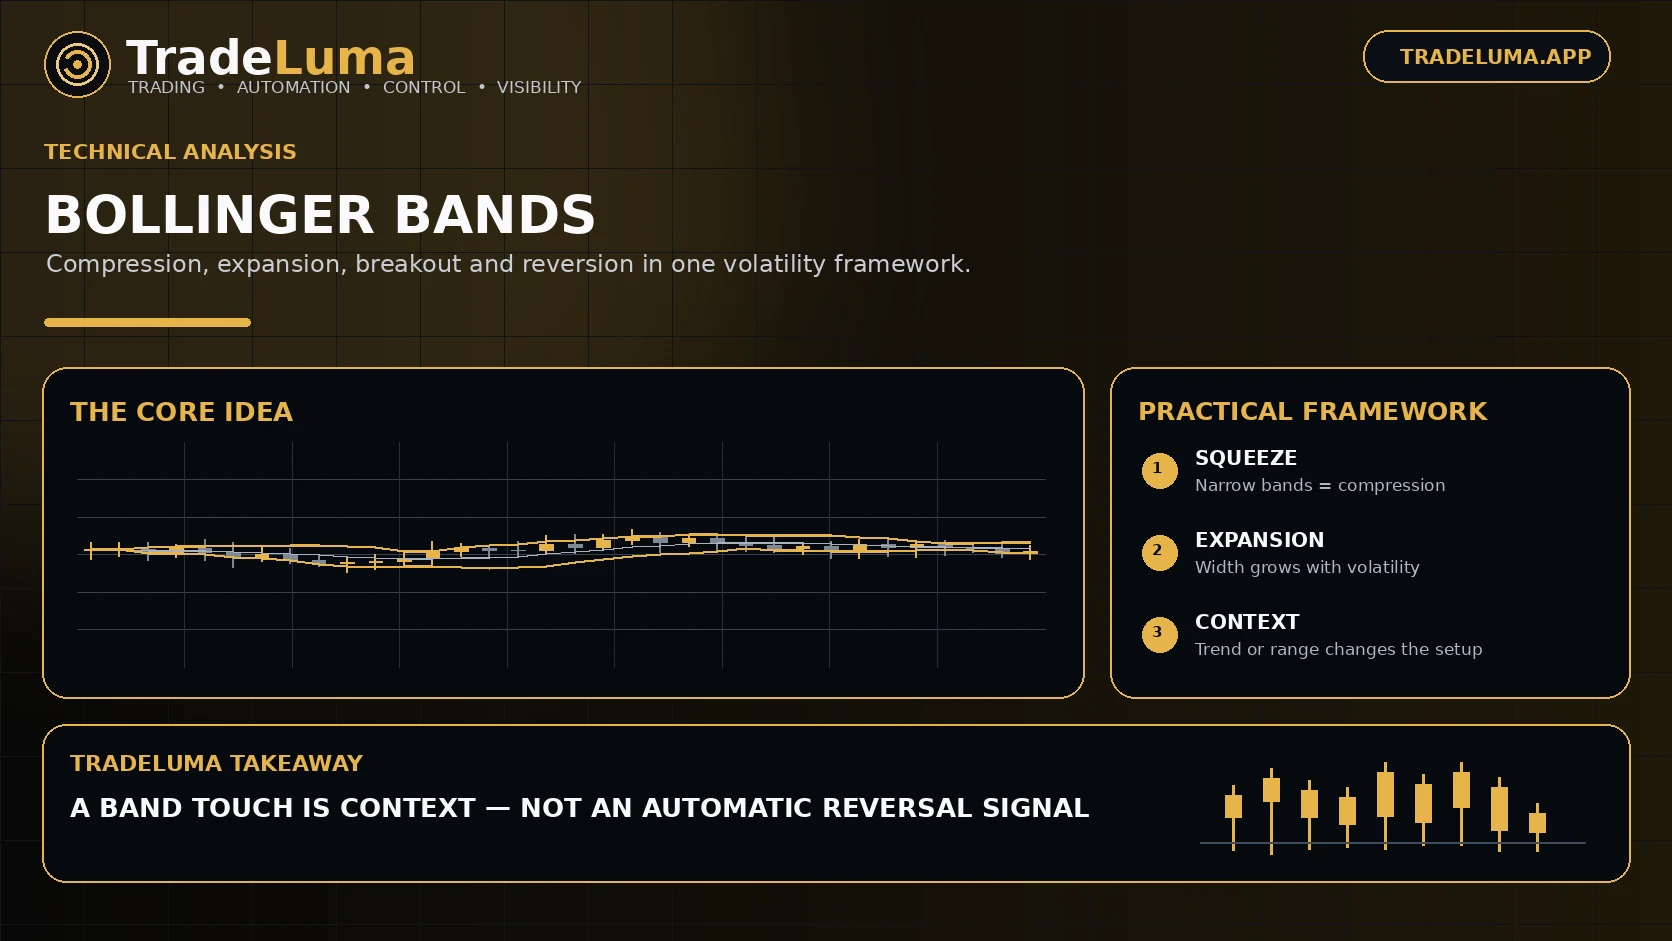
Learn how Bollinger Bands measure relative price and volatility, what a squeeze can indicate, and how traders use the bands for breakouts and mean-reversion setups.
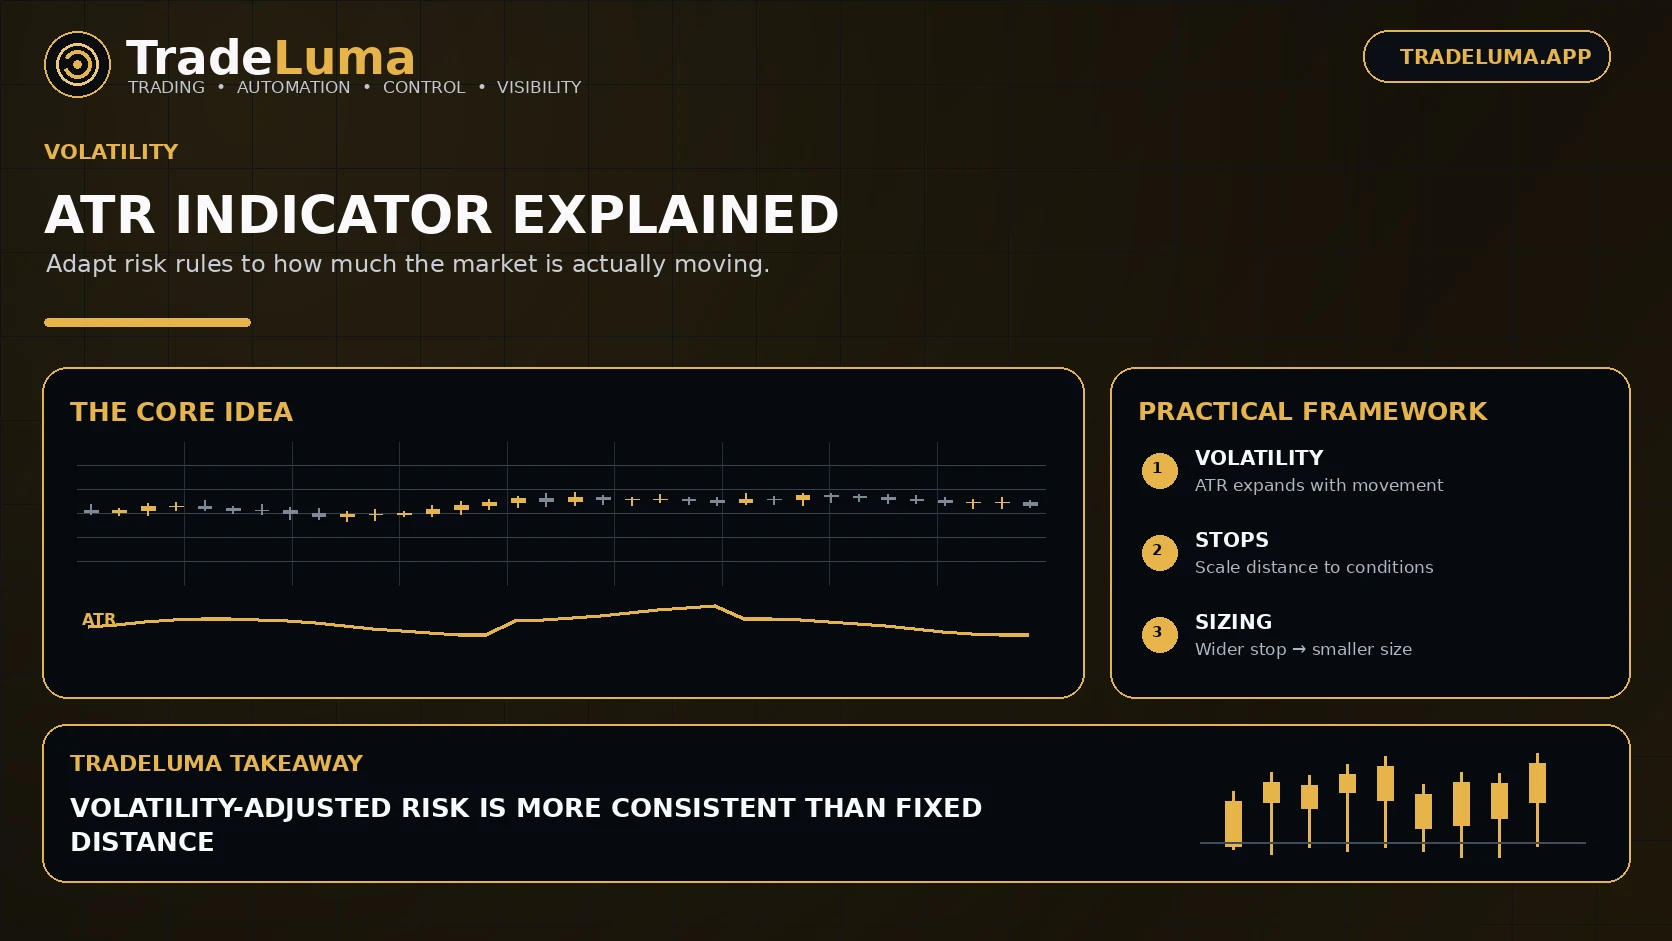
Understand Average True Range (ATR), how traders use it to measure volatility, adapt stop distances, compare market conditions, and support position sizing.
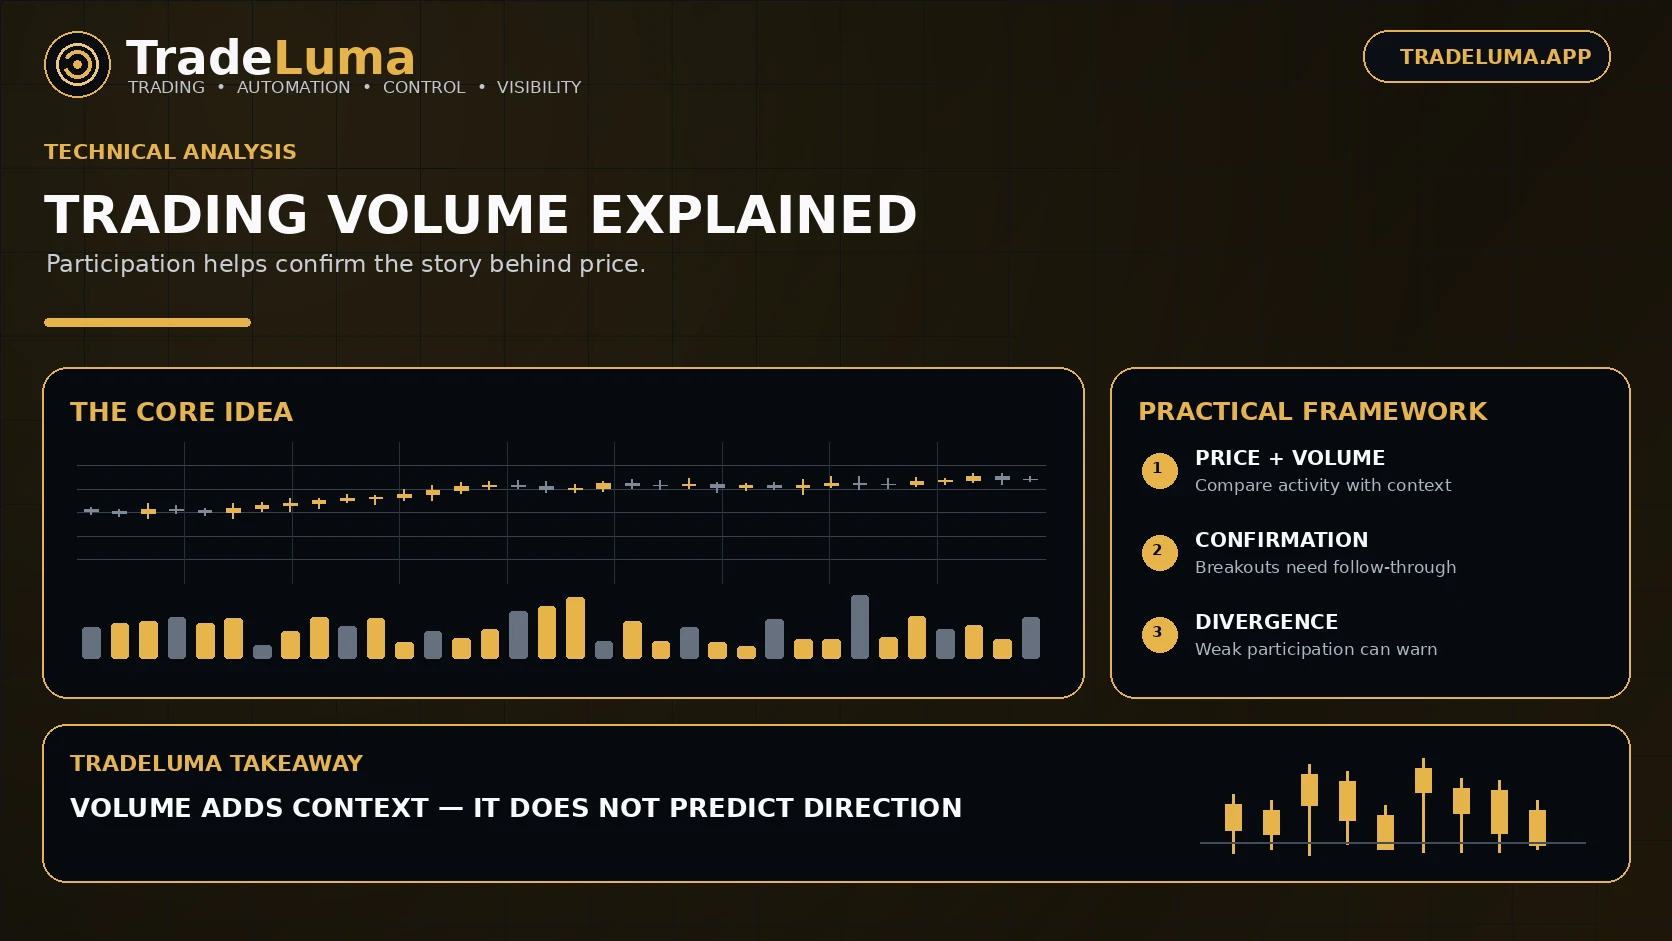
Learn how trading volume can confirm breakouts, reveal weak moves, support trend analysis, and add context to price action without becoming a standalone signal.
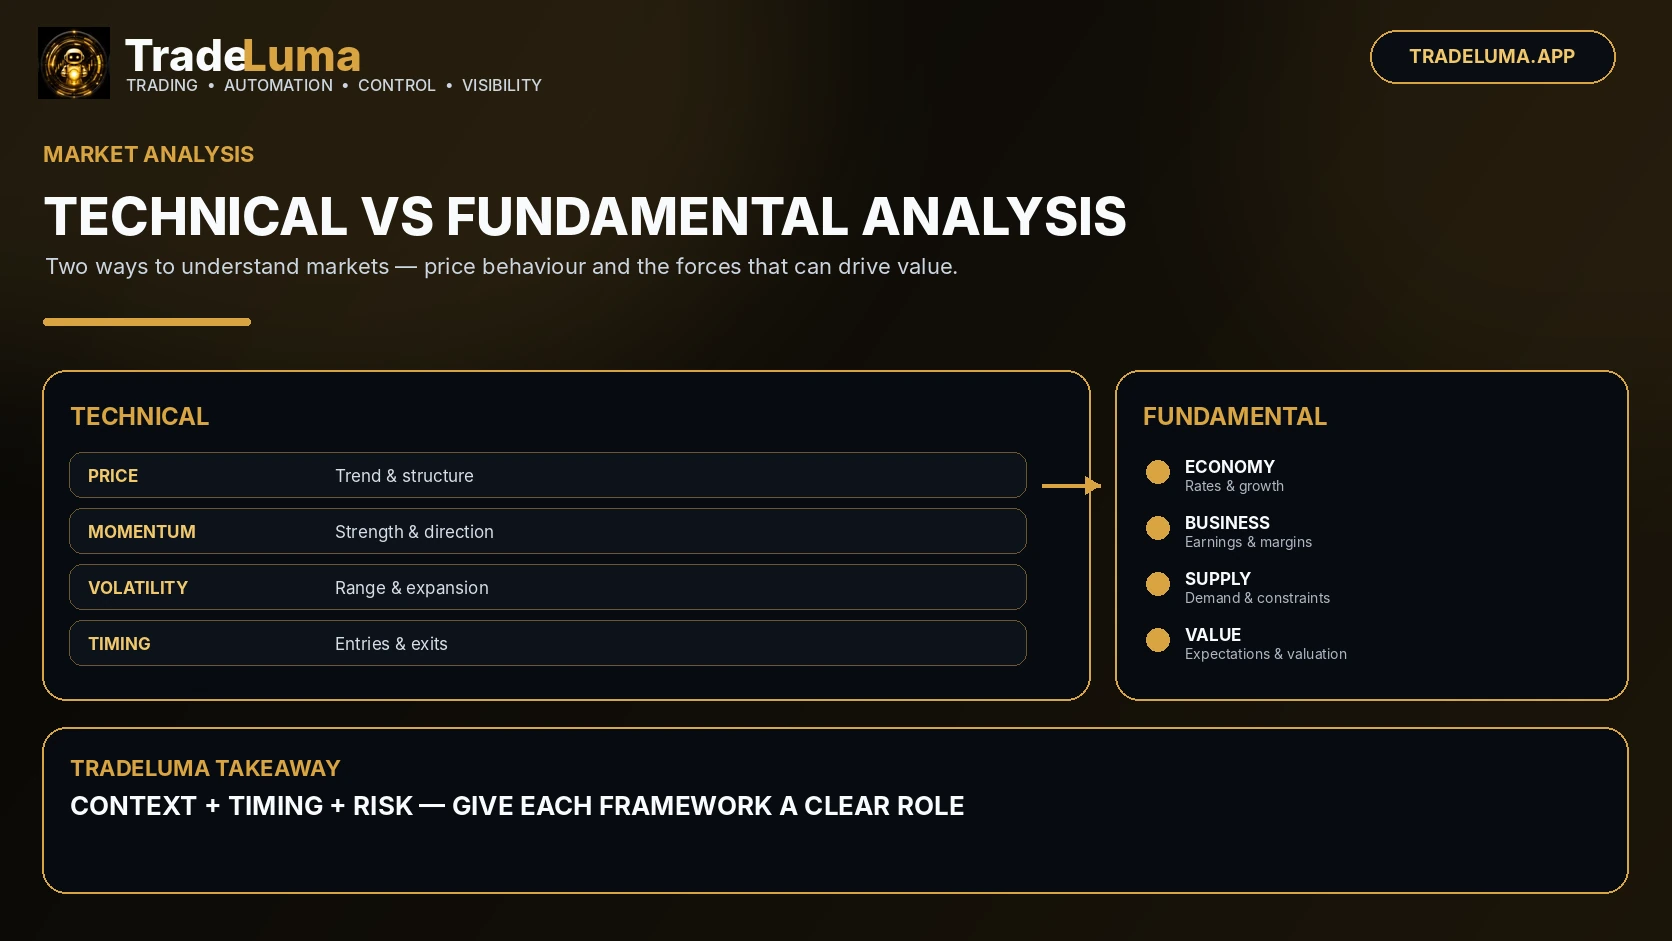
Compare technical and fundamental analysis, their strengths and limitations, and how traders can combine price-based signals with market drivers.
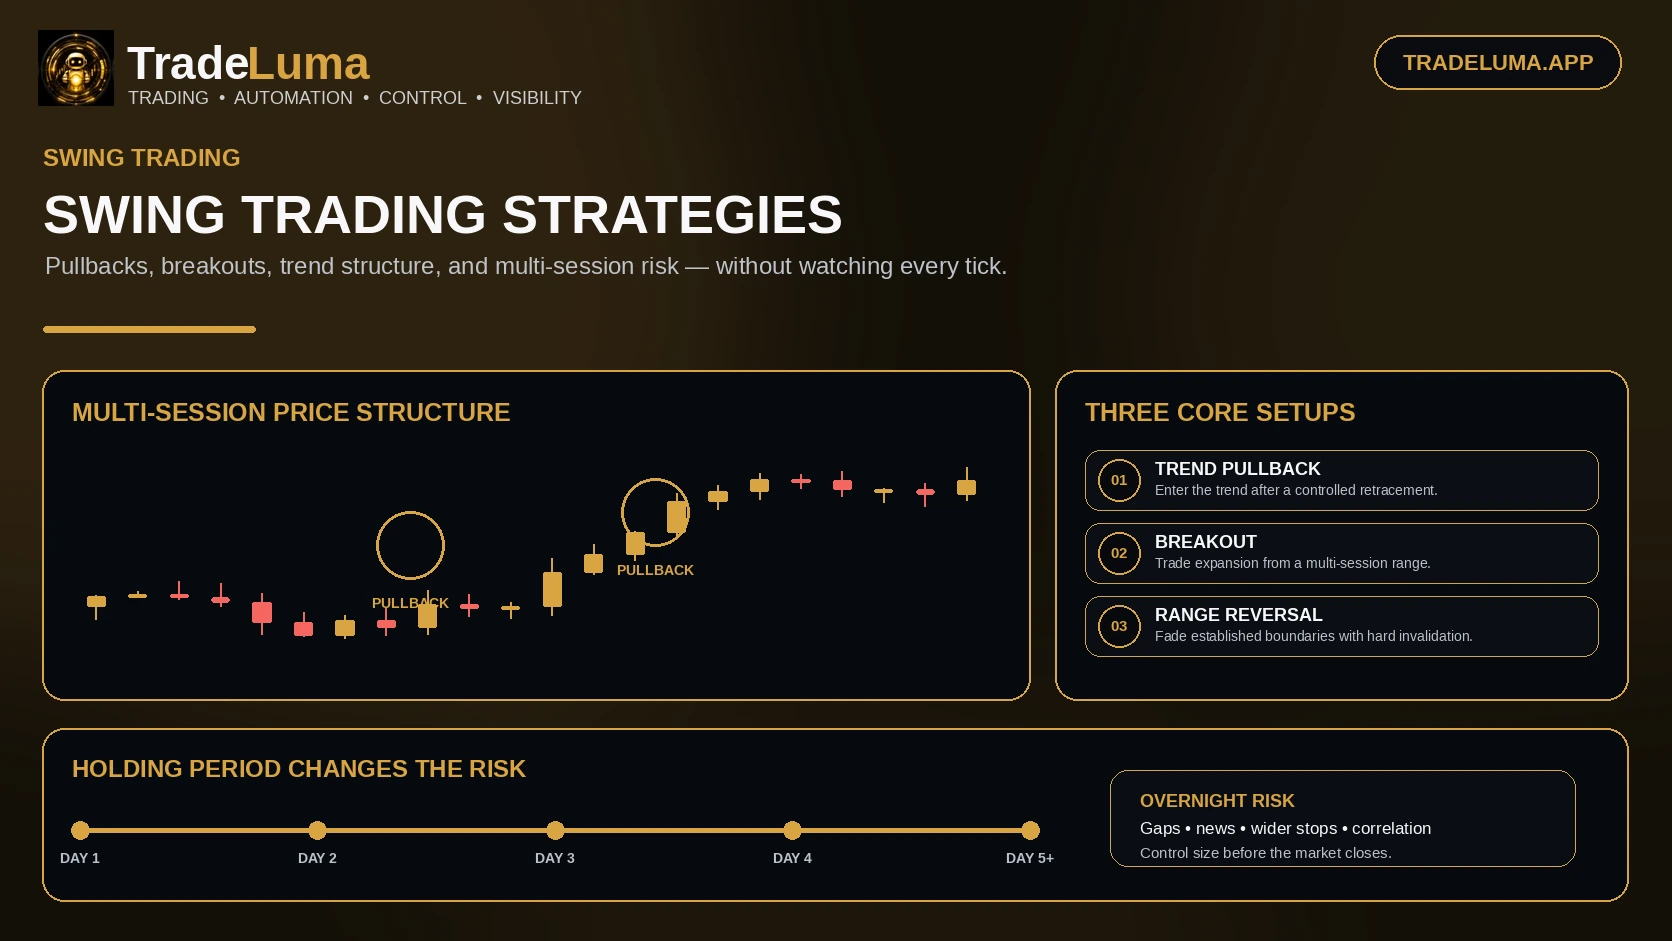
A practical guide to swing trading strategies, including trend pullbacks, breakouts, moving-average setups, range trades, stops, targets, and overnight risk.
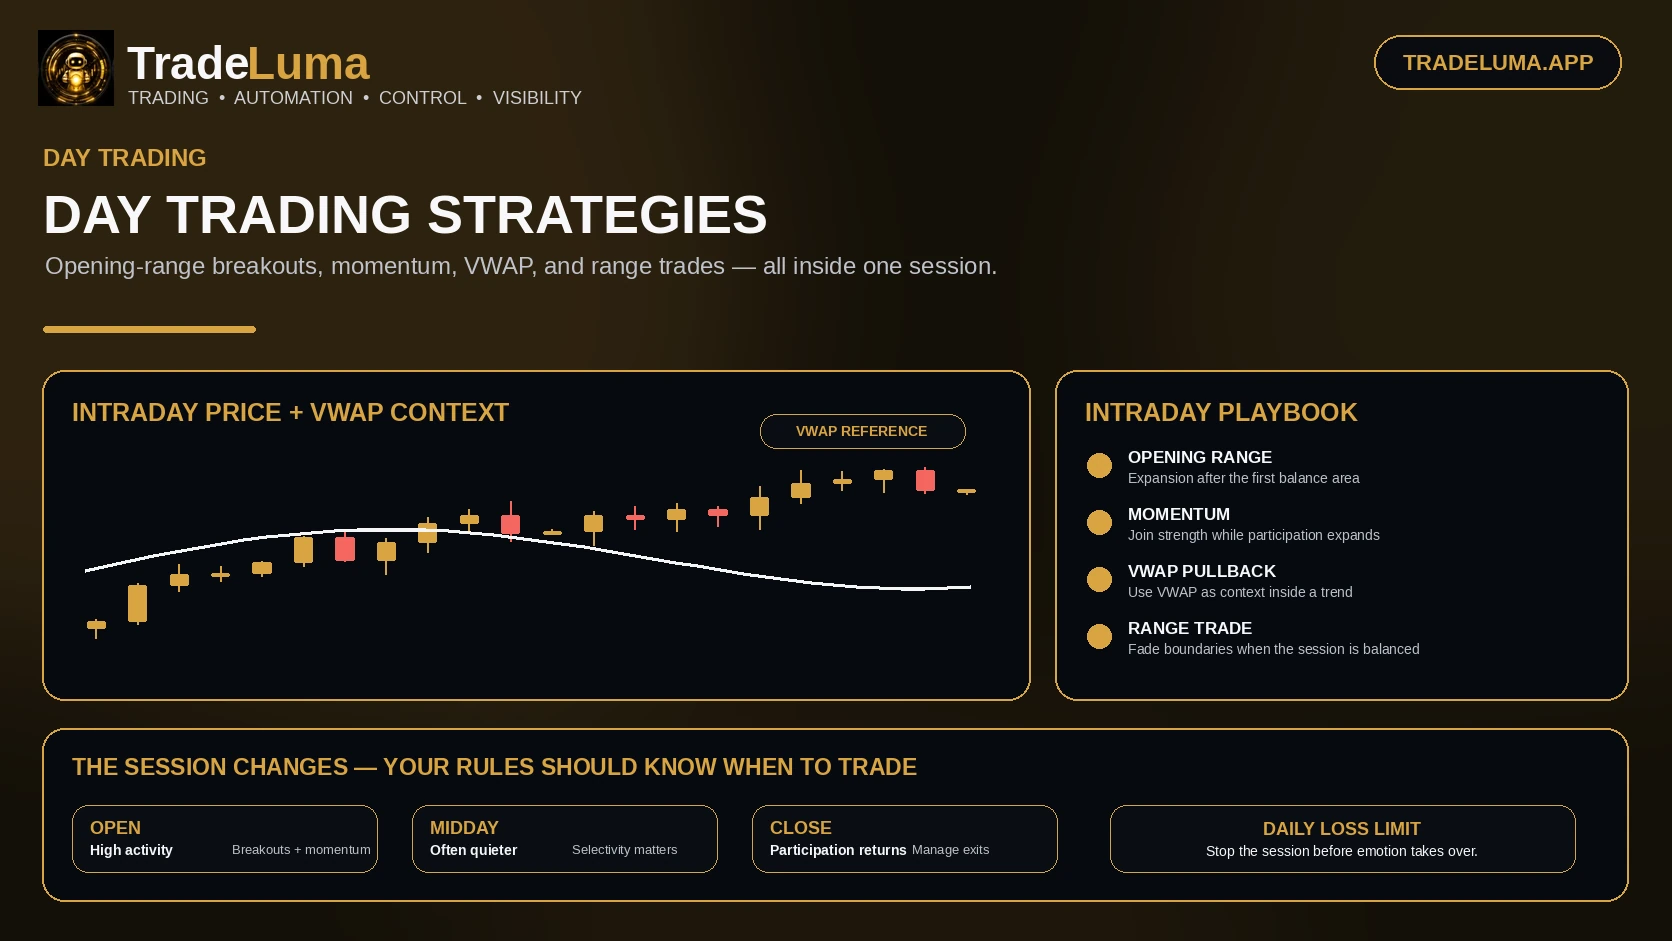
Explore practical day trading strategies including opening-range breakouts, momentum, VWAP pullbacks, range trades, risk controls, and intraday execution costs.

Compare seven widely used trading strategy styles, from trend following and breakouts to mean reversion, momentum, pullbacks, and pairs trading.
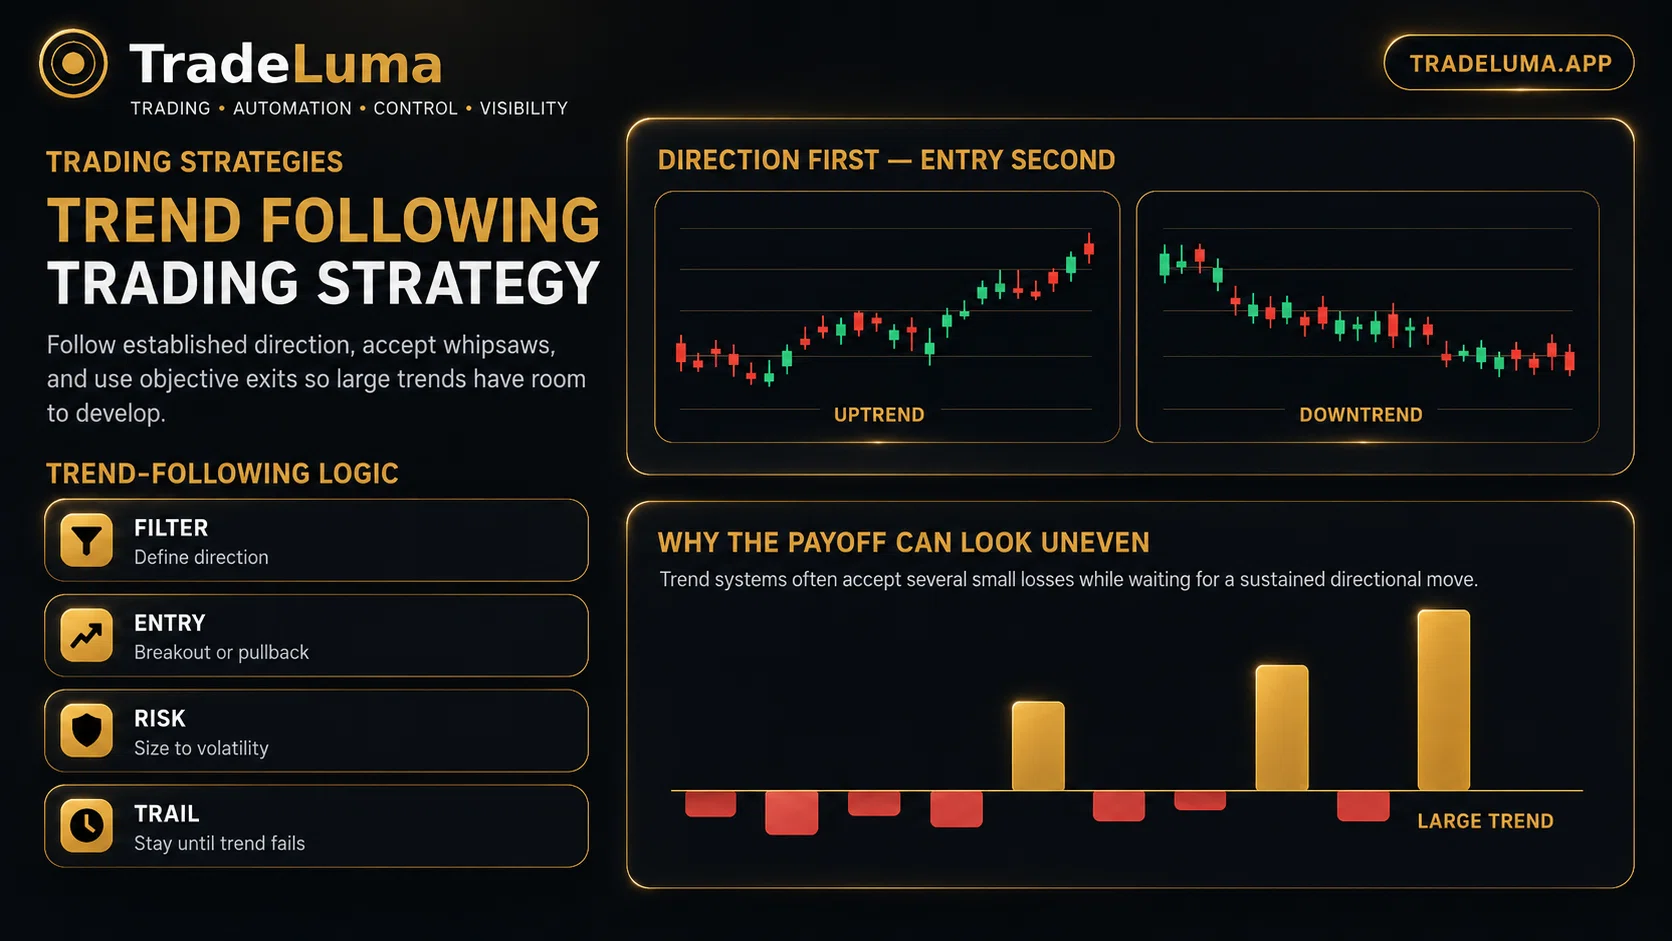
Learn how trend following strategies identify direction, enter pullbacks or breakouts, trail exits, manage whipsaws, and adapt risk to changing market conditions.
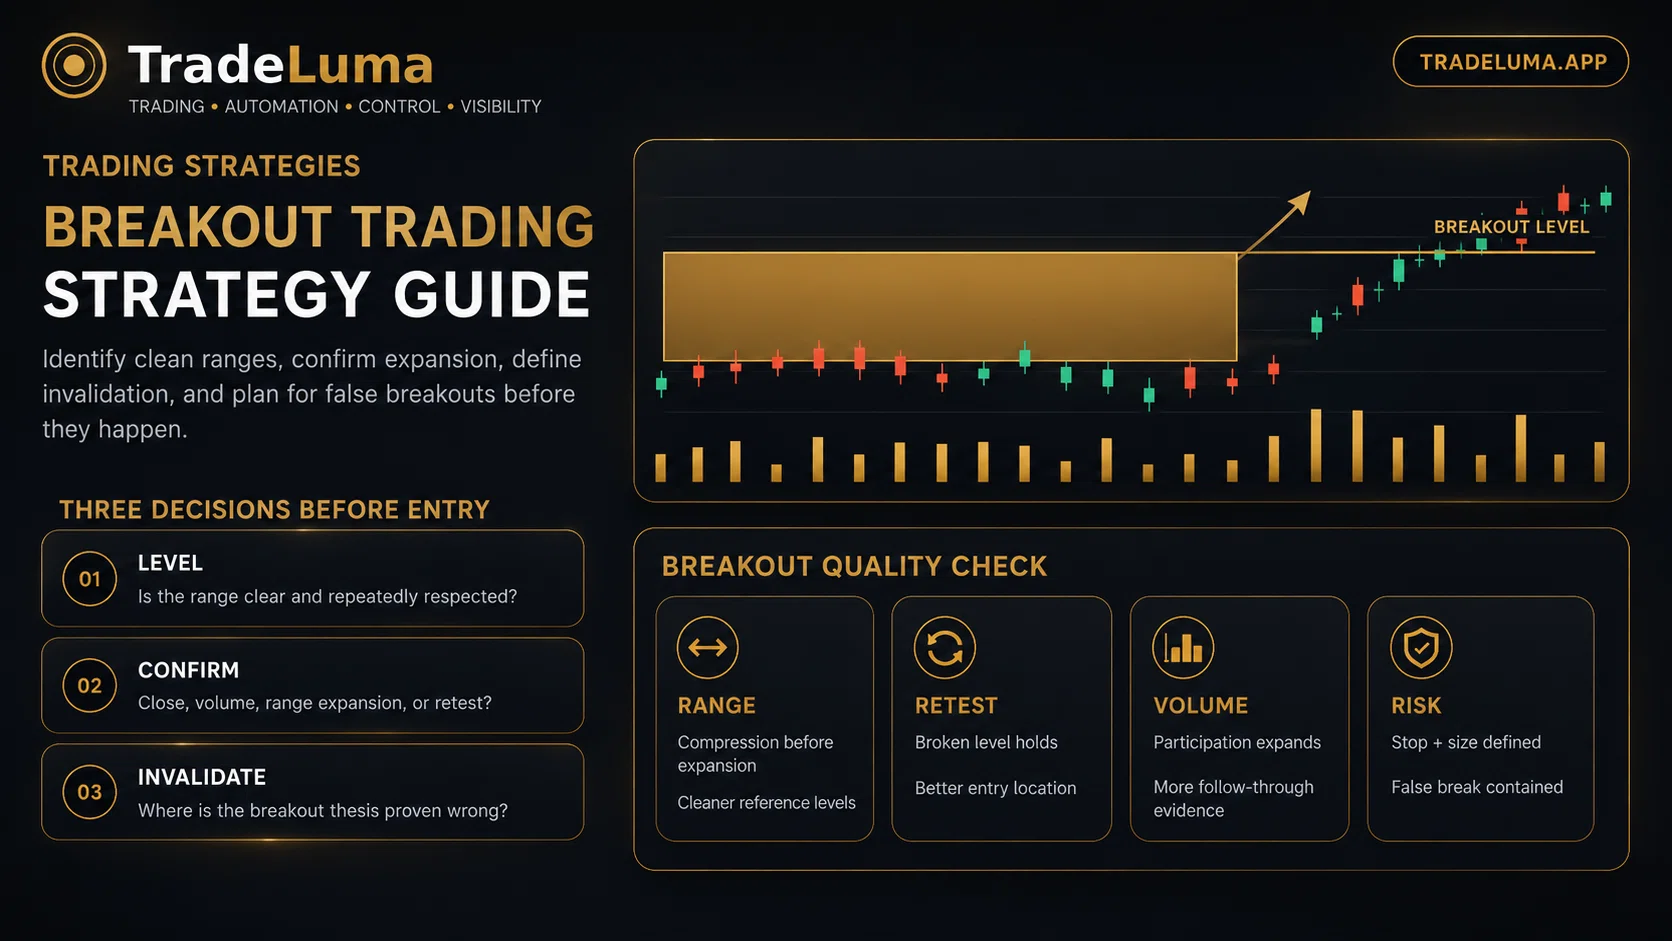
Learn how breakout trading works, how traders identify consolidation and key levels, and how confirmation, stops, volume, and risk controls can reduce false-breakout mistakes.
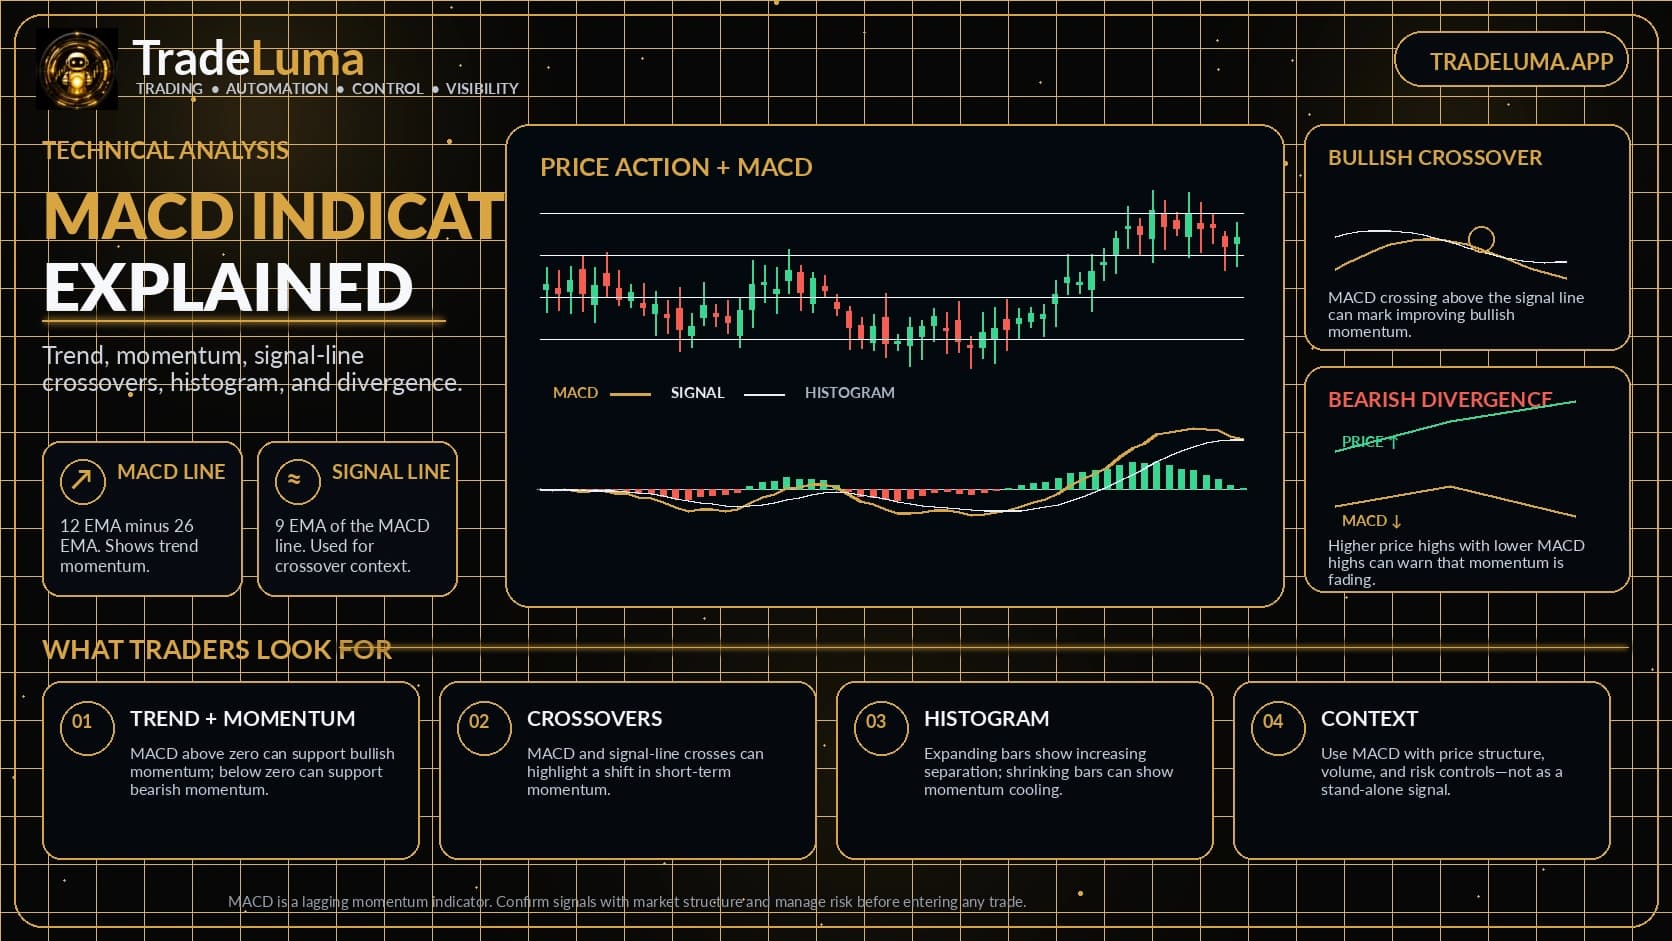
Learn how the MACD indicator works, what the signal line and histogram mean, and how traders read crossovers, zero-line momentum, and divergence.
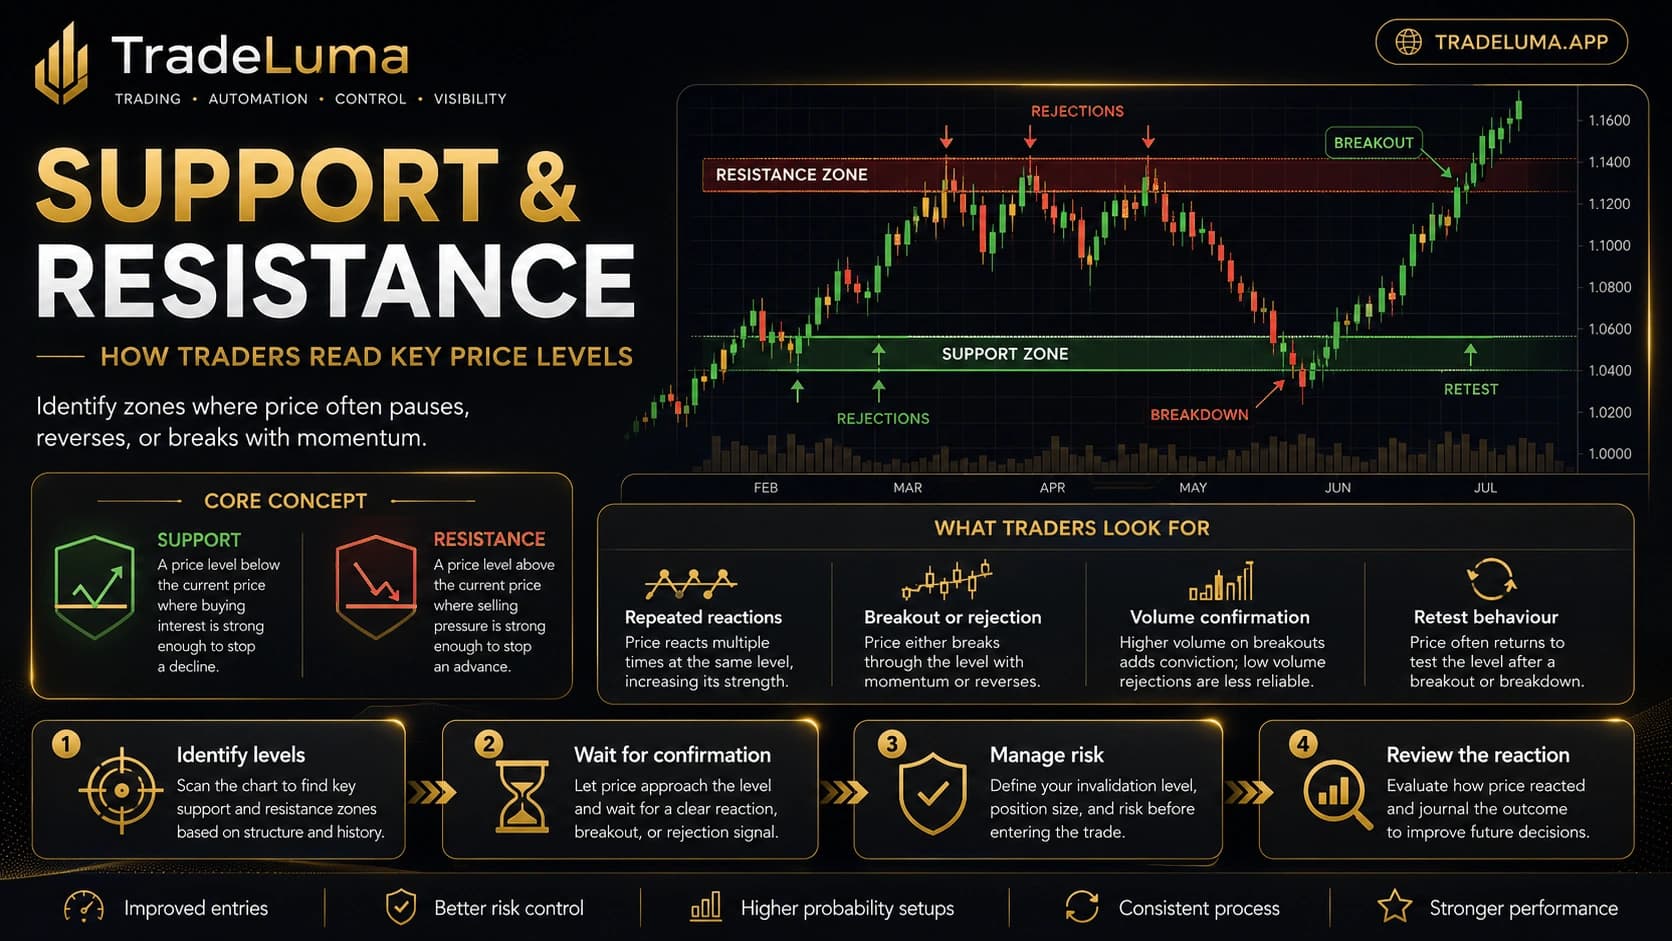
Learn what support and resistance mean, how traders identify key price levels, and how breakouts, rejections, and retests can shape better trade decisions.
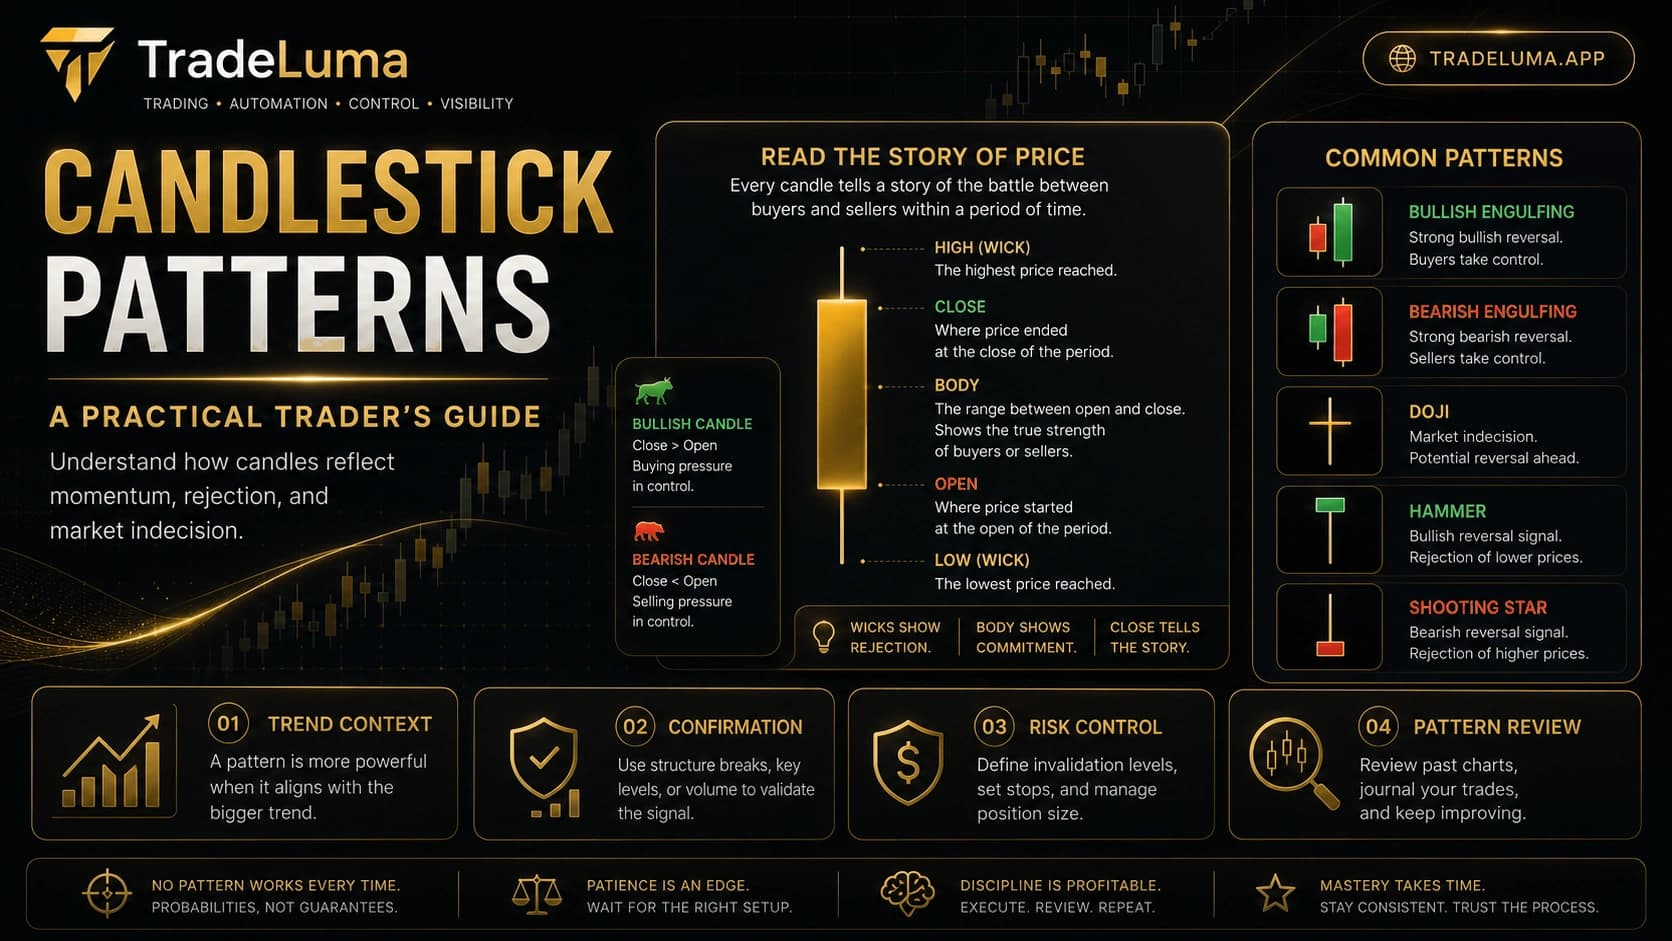
Understand the basics of candlestick patterns, what candle bodies and wicks mean, and how traders use pattern context, confirmation, and risk control.
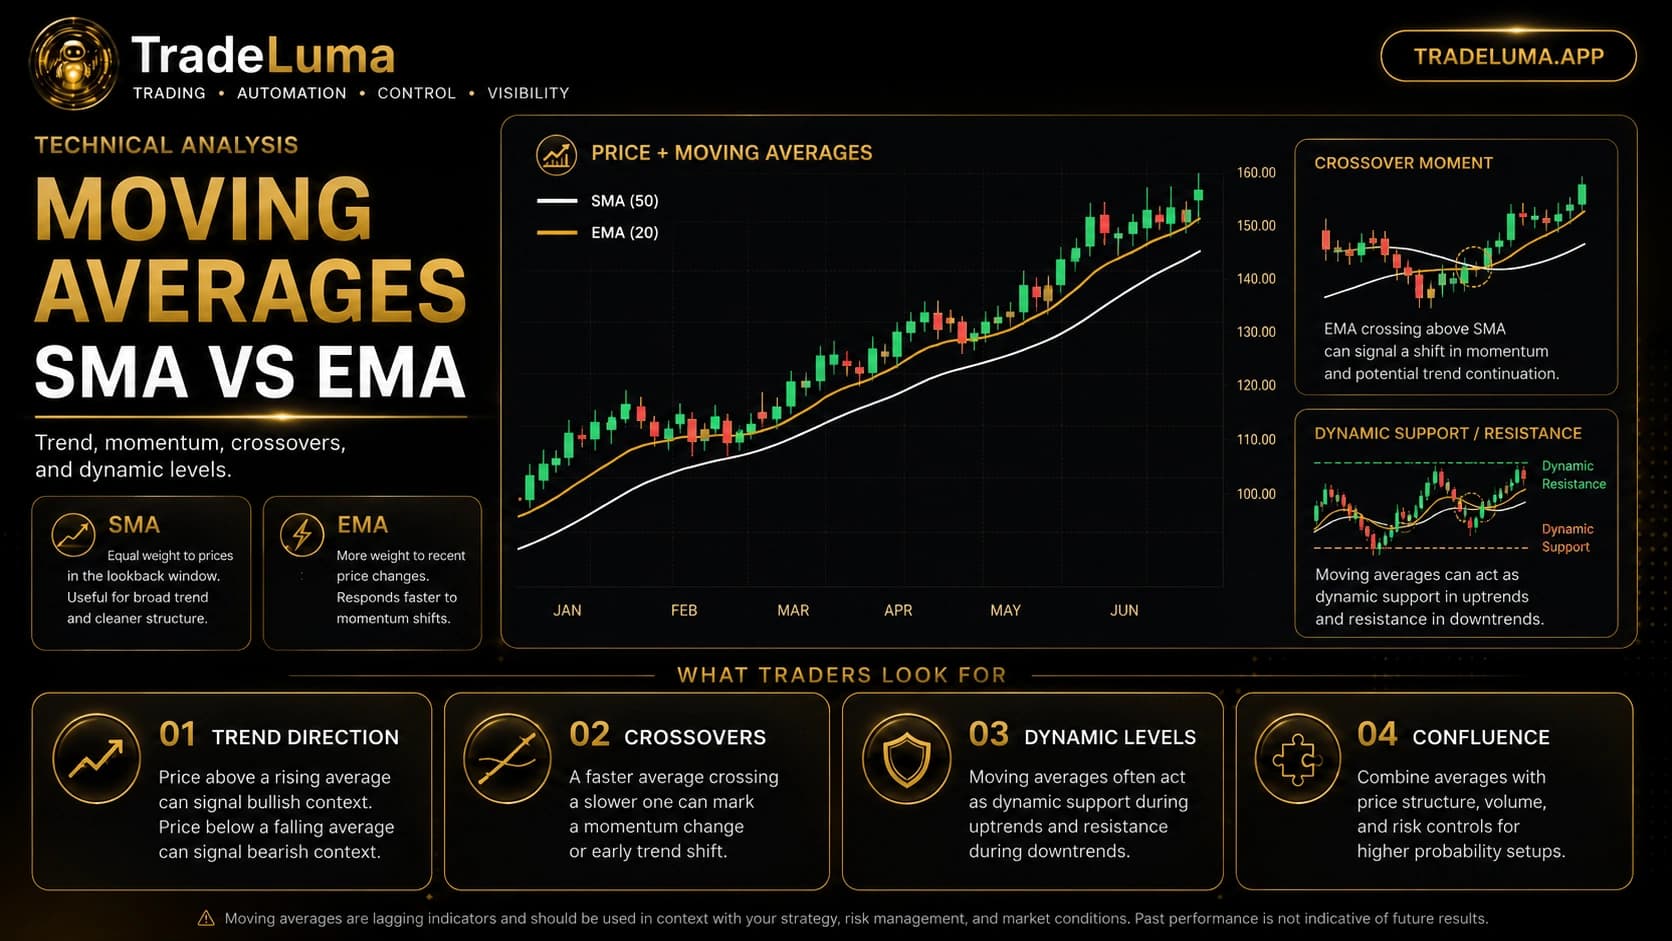
Learn how simple and exponential moving averages work, the difference between SMA and EMA, and how traders use trend, crossovers, and dynamic levels.
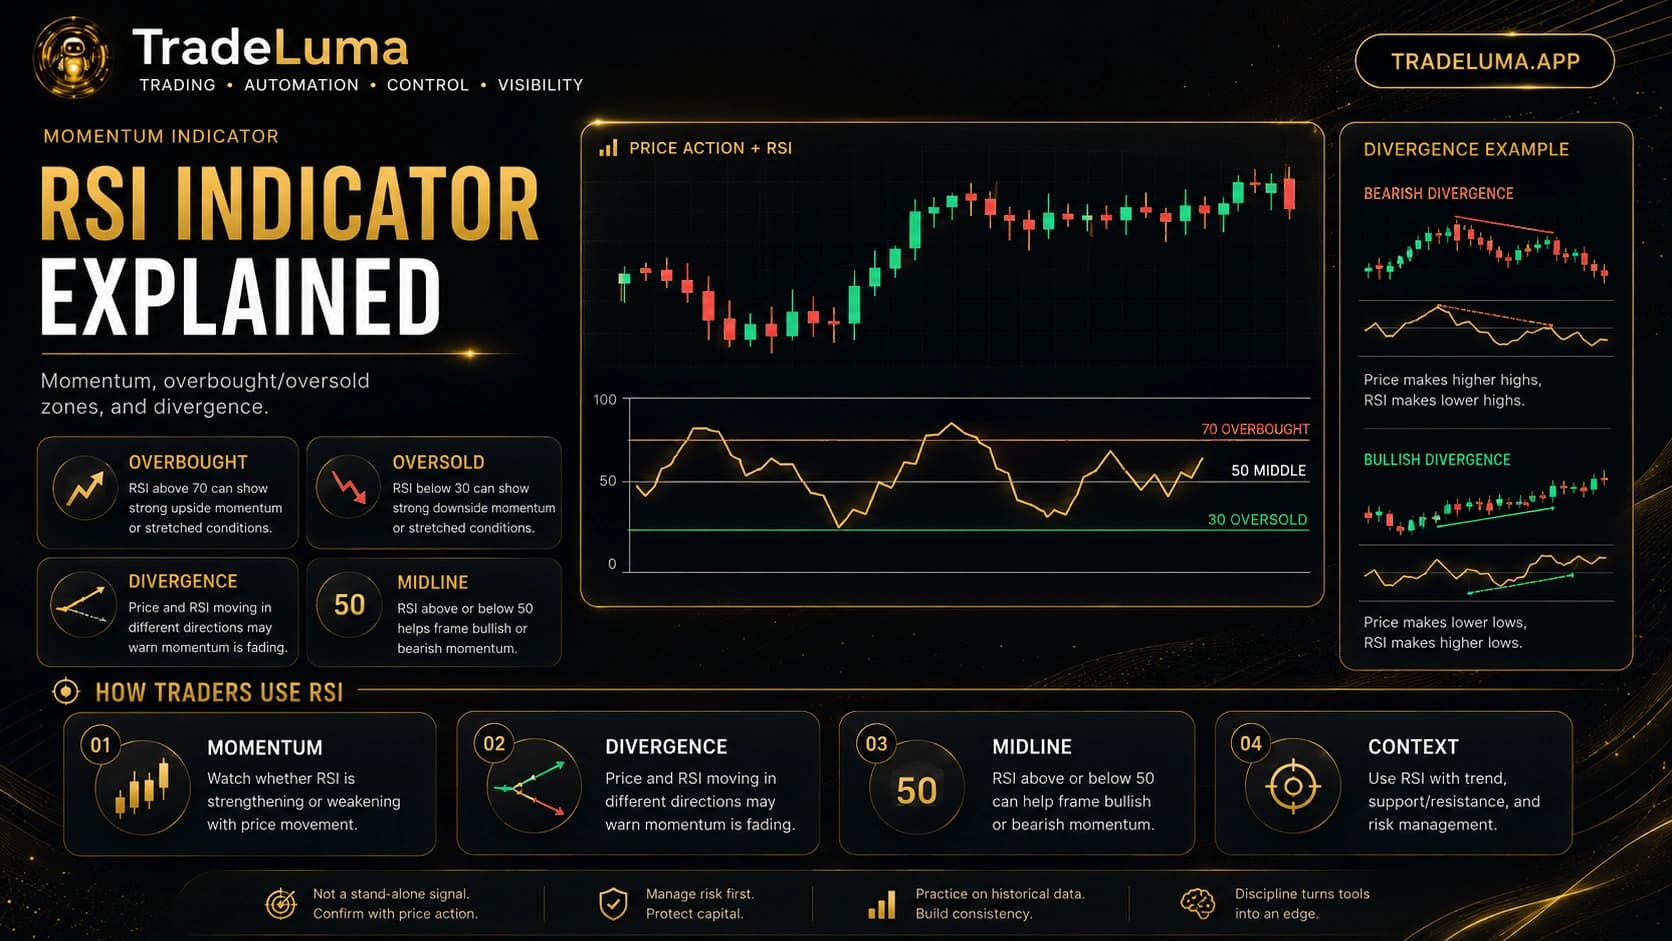
Learn how the RSI indicator works, what overbought and oversold levels mean, how traders use the 50 line, and how RSI divergence can signal momentum shifts.