
Technical Analysis
Market Structure in Trading: Higher Highs, Lower Lows and Trend Changes
Learn how market structure uses swing highs and lows to describe trends, ranges, breakouts, and possible trend changes without relying on prediction.
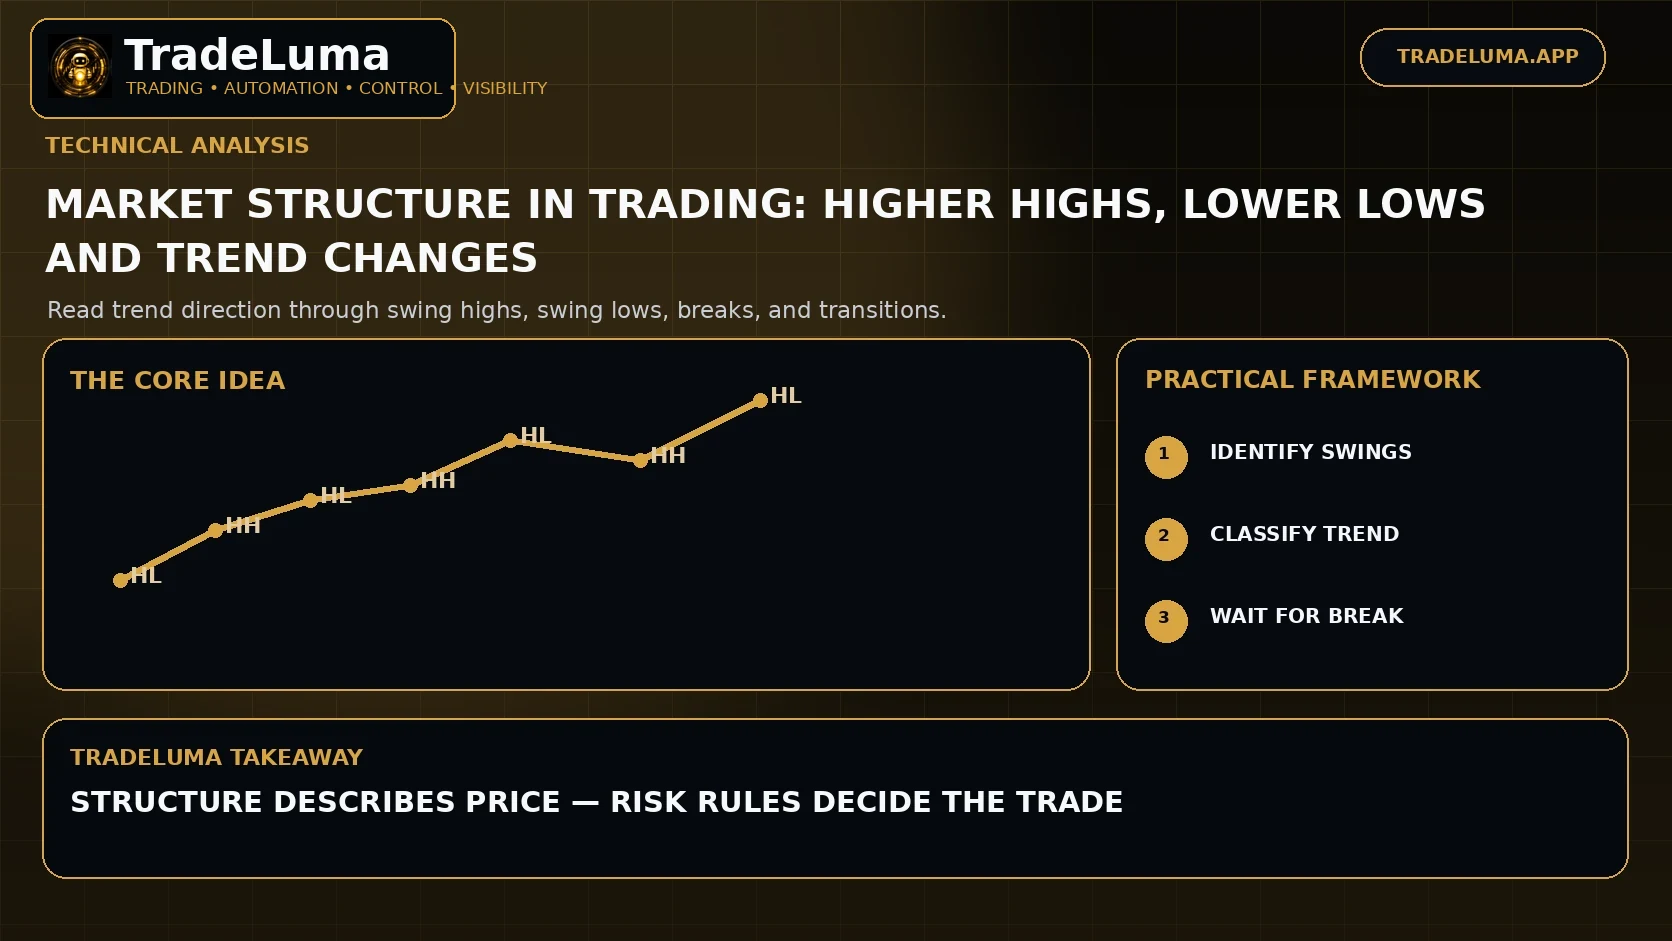
Market structure is the sequence of swing highs, swing lows, impulses, pullbacks, and ranges created as buyers and sellers compete. Traders use that sequence to describe whether price is trending, balancing, or attempting to reverse. The value of structure is not that it predicts the next move with certainty; it gives the trader objective reference points for trend direction, invalidation, entries, and exits.
What market structure means
Market structure is a way of organising price action into meaningful swings. Instead of reacting to every candle, the trader identifies areas where price clearly changed direction and then compares each new swing with the previous one.
That simple comparison creates a useful map. Rising swing highs and lows show persistent demand, falling swing highs and lows show persistent supply, and overlapping swings often indicate a range or transition rather than a clean trend.
Higher highs and higher lows
An uptrend is commonly described by higher highs and higher lows. The higher high shows that buyers were able to extend price beyond the previous peak, while the higher low shows that the following pullback held above the previous important low.
The sequence matters more than one isolated candle. A trader can use the most recent higher low as an invalidation reference while looking for continuation entries that align with the broader upward structure.
Lower highs and lower lows
A downtrend is the mirror image: price forms lower lows and rallies fail at lower highs. Sellers are repeatedly able to push below previous lows, while buyers cannot recover the prior swing high.
Short setups may use the lower-high area as a structural reference, but risk should still be defined before entry because sharp reversals can occur even inside established downtrends.
Ranges and overlapping structure
Not every market is trending. When highs and lows repeatedly overlap and neither side can maintain expansion, price is often rotating inside a range. In that environment, trend-following entries can be whipsawed because apparent breaks fail quickly.
Range traders may focus on the outer boundaries and the middle of the range, while trend traders can choose to wait for acceptance beyond a boundary before looking for continuation.
What a break of structure can mean
A break of structure occurs when price moves beyond a previously important swing point. In a trend, a continuation break can confirm that the existing direction remains active. Against the trend, a broken swing can be an early warning that control is changing.
The quality of the break matters. A brief wick through a level, a close beyond it, and sustained trade beyond it are not equivalent. Traders should define what counts as a valid break before testing the setup.
Trend change versus temporary pullback
One of the hardest problems is deciding whether a counter-trend move is only a pullback or the beginning of a reversal. A first broken swing may weaken the prior trend, but many reversals need additional evidence such as a failed retest, opposite-direction impulse, or new sequence of swings.
Using stages can help: established trend, structural warning, transition, and confirmed opposite structure. This prevents a trader from declaring every pullback a reversal too early.
Using multiple timeframes
Higher-timeframe structure can describe the dominant environment while a lower timeframe provides more precise execution. For example, a four-hour chart may be making higher highs and higher lows while a fifteen-minute chart temporarily falls during a pullback.
The lower timeframe should not be interpreted in isolation. A short-term downtrend inside a higher-timeframe uptrend can simply be the mechanism that creates the next higher low.
Common market-structure mistakes
A common mistake is redrawing swing points until they fit the desired trade. Another is treating every tiny pivot as equally important, which creates so much noise that structure loses meaning.
Choose a repeatable swing definition, distinguish major from minor pivots, and avoid using labels as certainty. Structure describes what price has done; it does not remove the need for risk controls.
How to test a structure-based strategy
Define the timeframe, swing rule, trend state, exact break condition, entry trigger, invalidation point, and exit. Then test the same definitions across trending, ranging, and volatile periods.
Review whether the strategy depends on subjective hindsight. The strongest rules are clear enough that two people using the same data would mark broadly the same structure.
Frequently asked questions
What is market structure in trading?
Market structure is the pattern created by swing highs, swing lows, impulses, pullbacks, and ranges. Traders use it to describe trend direction and important price references.
What do higher highs and higher lows mean?
They generally describe an uptrend because price is extending upward while pullbacks continue to hold above earlier important lows.
Does a break of structure confirm a reversal?
Not always. A broken swing can be an early warning, but follow-through, retests, higher-timeframe context, and the formation of new opposite-direction structure can provide stronger evidence.
Which timeframe is best for market structure?
There is no universal best timeframe. Traders often use a higher timeframe for context and a lower timeframe for entries, provided both are defined consistently.
Continue learning
Related TradeLuma guides
Technical Analysis
Volume Profile Explained: Value Areas, Point of Control and Market Context
11 Sept 2026 · 12 min read
Technical Analysis
Trading Volume Explained: How to Read Volume and Confirm Price Moves
22 Aug 2026 · 11 min read
Technical Analysis
Divergence Trading Guide: RSI, MACD and Price Divergence Explained
12 Sept 2026 · 11 min read
Build a controlled automation workflow with TradeLuma
Configure alerts, test in paper mode, apply execution controls, and follow broker outcomes from one workspace.