
Technical Analysis
Volume Profile Explained: Value Areas, Point of Control and Market Context
Learn how volume profile distributes traded volume by price, what the point of control and value area mean, and how traders use high- and low-volume nodes.
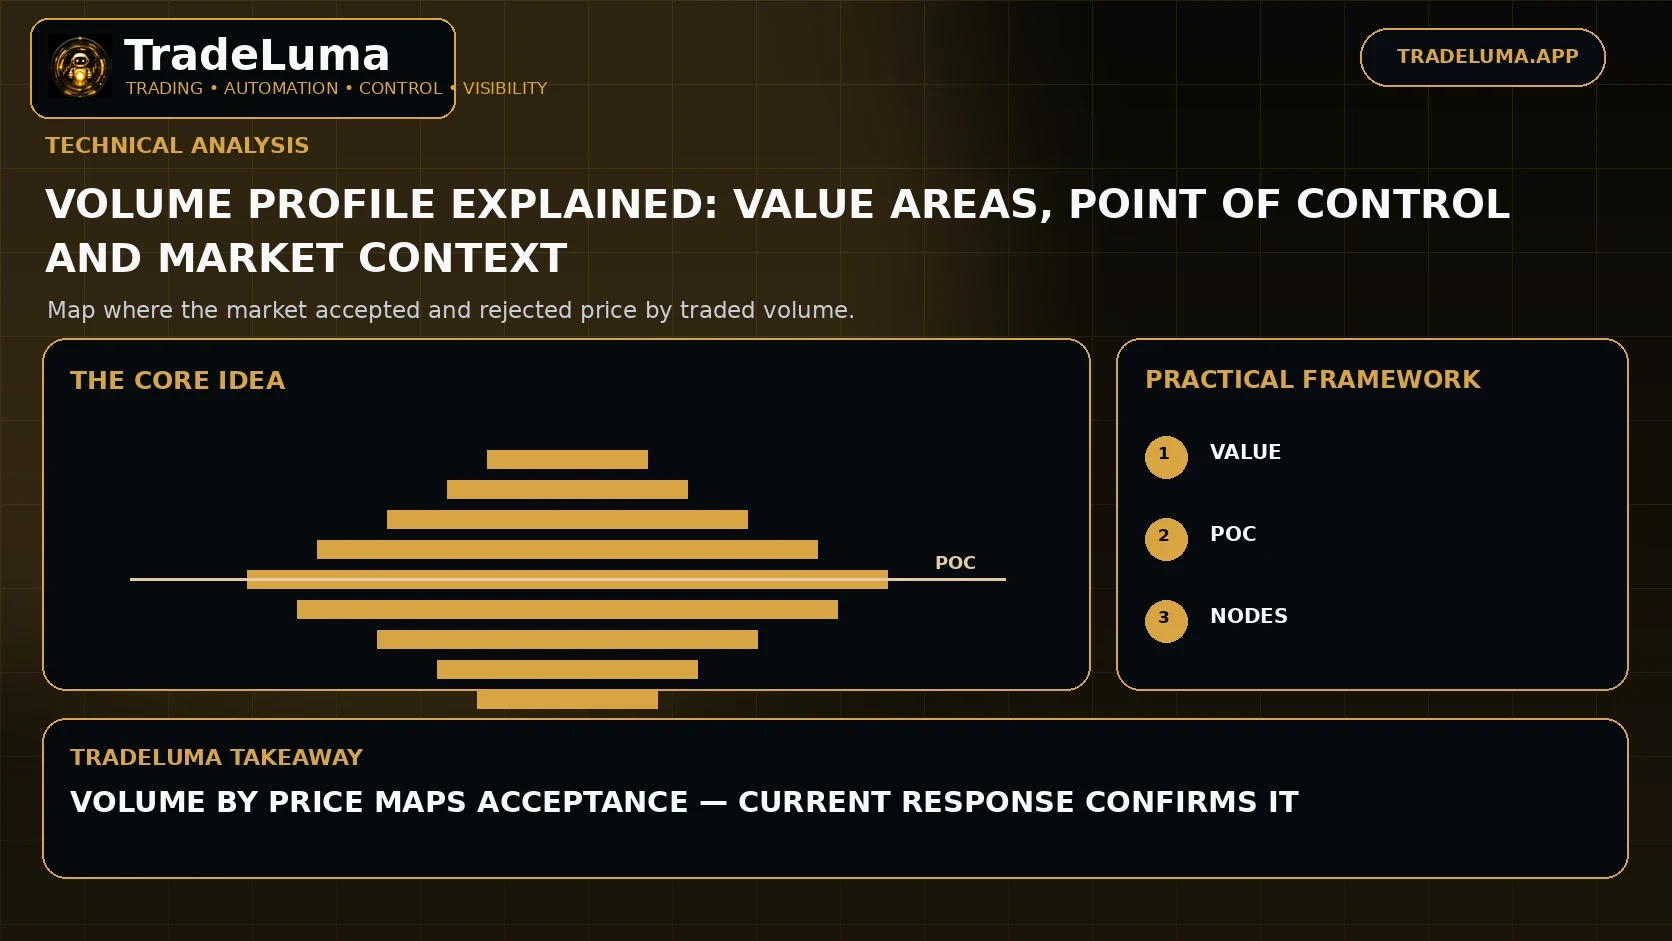
Traditional volume bars show how much traded during each time period. Volume profile reorganises that information by price, showing where the market conducted the most and least business across a chosen range or session. Traders use the profile to identify accepted value, potential support or resistance, and areas where price previously moved quickly through low participation.
Volume by price versus volume by time
A normal volume histogram answers how much traded during each bar. Volume profile answers where that trading occurred across price levels. This can reveal areas where the market repeatedly accepted price and areas it passed through quickly.
The method is descriptive. It does not guarantee that a high-volume area will hold or that a low-volume area will always be crossed rapidly.
Point of control
The point of control, or POC, is the price level or bucket with the highest measured volume in the selected profile. It often represents a centre of historical activity or balance.
Because the profile depends on its start and end points, two traders using different sessions or anchors can produce different POCs from the same market.
Value area high and low
The value area is the region containing a chosen percentage of total volume, commonly about 70 percent. Value Area High and Value Area Low mark its upper and lower boundaries.
Traders may use these levels to frame acceptance inside value and potential imbalance outside value, but the behaviour should be tested for the chosen market and session.
High-volume nodes
High-volume nodes are areas where substantial trading occurred. Price may spend more time there because buyers and sellers previously found enough agreement to transact heavily.
When revisited, a high-volume node can act as a magnet, a balance zone, or a support/resistance reference depending on how price approaches it.
Low-volume nodes
Low-volume nodes show areas with relatively little historical business. Price may have moved quickly through them because the auction found limited two-sided agreement.
Some traders expect future moves through low-volume areas to remain fast, but this is not guaranteed because new information can create entirely different participation.
Session profiles versus composite profiles
A session profile isolates one trading session and is useful for intraday context. A composite profile combines a longer period and can reveal broader areas of acceptance across many days or weeks.
Choose the profile horizon to match the intended holding period. A scalper and a swing trader may care about very different reference areas.
Profile and price action
Volume profile is most useful when combined with current price response. A level that was important historically matters more when the present market also reacts, rejects, accepts, or accelerates around it.
Blindly buying every high-volume node or selling every value-area high ignores trend, volatility, and the possibility that the market is establishing new value.
Using profile for trade planning
A trade plan can use profile levels to define entry zones, invalidation, targets, and scenarios. For example, acceptance above prior value can support a continuation thesis, while rejection back inside value can support a mean-reversion thesis.
The scenario should be defined before the reaction occurs so the same chart is not interpreted differently after each outcome.
How to test volume-profile ideas
Fix the profile session, price-bucket method, value-area percentage, and exact entry conditions. Test the rules across different volatility regimes and include realistic execution costs.
Be careful with data quality. Some markets provide true exchange volume while others may use tick volume or broker-specific feeds, which can change the profile.
Frequently asked questions
What is volume profile?
Volume profile shows how much trading occurred at different price levels over a selected period rather than showing volume only by time bar.
What is the point of control?
The point of control is the price level or bucket with the highest measured volume in the selected profile.
What is a value area in volume profile?
It is the price region containing a chosen percentage of the profile's total volume, commonly around 70 percent by convention.
Are high-volume nodes always support or resistance?
No. They are historical areas of heavy participation. Future behaviour depends on trend, approach, current order flow, and whether the market is accepting or rejecting the area.
Continue learning
Related TradeLuma guides
Technical Analysis
VWAP Trading Guide: Using Volume-Weighted Average Price Intraday
27 Aug 2026 · 11 min read
Technical Analysis
Divergence Trading Guide: RSI, MACD and Price Divergence Explained
12 Sept 2026 · 11 min read
Technical Analysis
Market Structure in Trading: Higher Highs, Lower Lows and Trend Changes
31 Aug 2026 · 11 min read
Build a controlled automation workflow with TradeLuma
Configure alerts, test in paper mode, apply execution controls, and follow broker outcomes from one workspace.