
Technical Analysis
Divergence Trading Guide: RSI, MACD and Price Divergence Explained
Learn bullish and bearish divergence, hidden divergence, why momentum can diverge from price, and how to use confirmation instead of predicting reversals too early.
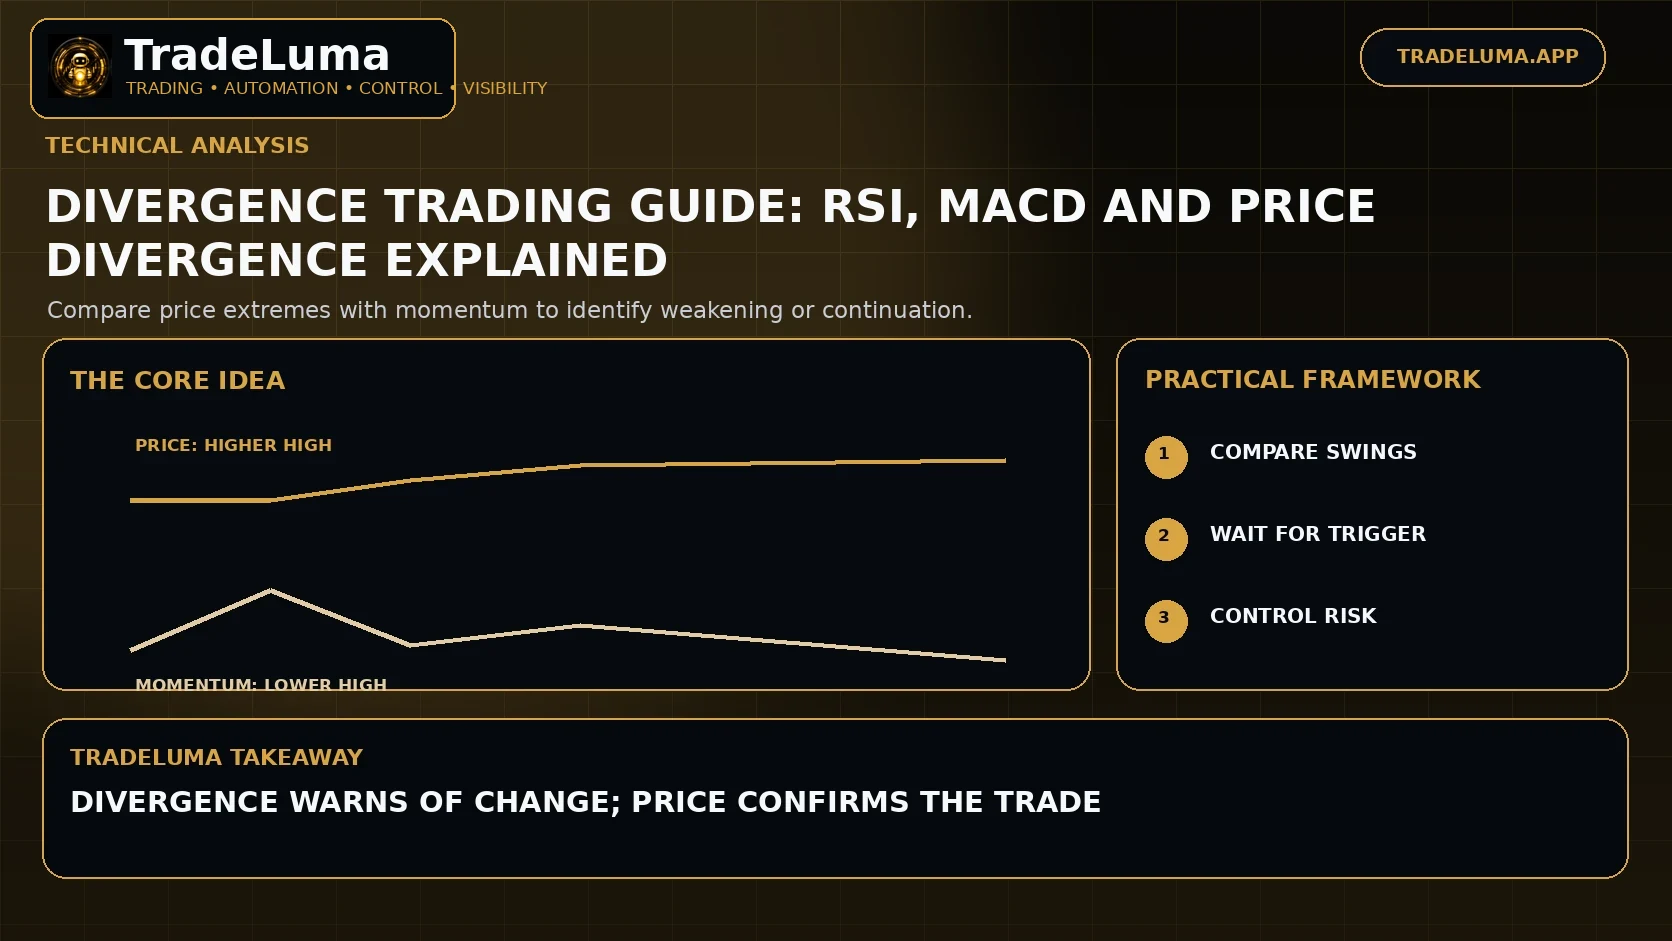
Divergence occurs when price and a momentum indicator move differently. A market may make a new price high while RSI or MACD momentum fails to make a corresponding high, suggesting the latest push has less momentum than the previous one. Divergence can provide useful context, but it is an early-warning tool rather than a guaranteed reversal signal; trends can continue for a long time while momentum diverges.
What divergence means
Divergence compares the direction of price swings with the direction of indicator swings. If price extends to a new extreme but the indicator does not, the rate or quality of momentum behind the move may be changing.
The comparison should use corresponding swing points. Choosing unrelated peaks and troughs after the fact can create misleading signals.
Regular bullish divergence
Regular bullish divergence occurs when price makes a lower low while the indicator makes a higher low. It suggests downside momentum has weakened relative to the previous selloff.
It is not automatically a buy signal. Price can continue lower, so many strategies wait for a higher low, resistance break, or other evidence that buyers have actually taken control.
Regular bearish divergence
Regular bearish divergence occurs when price makes a higher high while the indicator makes a lower high. The new price extreme is being made with weaker measured momentum.
Strong trends can produce repeated bearish divergences before reversing, which makes early counter-trend entries especially risky.
Hidden divergence
Hidden bullish divergence occurs when price forms a higher low while the indicator forms a lower low; hidden bearish divergence occurs when price forms a lower high while the indicator forms a higher high. Traders often interpret these as continuation signals.
Because hidden divergence depends on an existing trend, market-structure rules should establish that trend before the indicator signal is considered.
RSI divergence
RSI compares the magnitude of recent gains and losses. Divergence in RSI can show that the balance of momentum is changing even while price still makes a new extreme.
RSI settings affect the sensitivity of the signal. Shorter periods create more fluctuations and potentially more divergence signals, while longer settings are smoother.
MACD divergence
MACD is based on the relationship between moving averages and can show divergence through the MACD line or histogram. It often responds differently from RSI because it measures momentum in another way.
A trader should specify which MACD component is used and avoid switching between them to fit each historical example.
Confirmation after divergence
Possible confirmation includes a trendline break, swing-structure break, moving-average reclaim, candlestick reversal, or break of the trigger bar. Waiting for confirmation means a later entry but can reduce attempts against a still-dominant trend.
The confirmation rule should be objective enough to backtest and should define exactly where the trade is invalidated.
When divergence fails
Divergence fails most often when a strong fundamental or technical trend continues despite slowing momentum. An indicator can flatten simply because the market has already moved a long distance, not because a reversal is imminent.
Counter-trend strategies should therefore control the number of attempts and the amount of risk allocated to early reversal signals.
How to backtest divergence
Define corresponding swing points, indicator settings, minimum divergence size, confirmation, stop, and target. Use the same algorithm for every trade so the pattern is not identified with hindsight.
Compare regular and hidden divergence separately and segment results by trend regime. Their behaviour and purpose are different.
Frequently asked questions
What is bullish divergence?
Regular bullish divergence occurs when price makes a lower low while a momentum indicator makes a higher low, suggesting downside momentum has weakened.
What is bearish divergence?
Regular bearish divergence occurs when price makes a higher high while a momentum indicator makes a lower high, suggesting upside momentum has weakened.
Does divergence predict reversals?
It can warn that momentum is changing, but it does not reliably identify the exact turning point. Strong trends can continue despite divergence.
What is hidden divergence?
Hidden divergence compares a trend-preserving price swing with a more extreme indicator swing and is commonly used as a continuation concept rather than a reversal concept.
Continue learning
Related TradeLuma guides
Technical Analysis
Volume Profile Explained: Value Areas, Point of Control and Market Context
11 Sept 2026 · 12 min read
Technical Analysis
Ichimoku Cloud Trading Guide: Trend, Momentum and Support/Resistance
10 Sept 2026 · 12 min read
Technical Analysis
Stochastic Oscillator Explained: Overbought, Oversold and Crossovers
9 Sept 2026 · 10 min read
Build a controlled automation workflow with TradeLuma
Configure alerts, test in paper mode, apply execution controls, and follow broker outcomes from one workspace.