
Technical Analysis
Ichimoku Cloud Trading Guide: Trend, Momentum and Support/Resistance
Learn the Ichimoku Cloud components, how traders read trend and momentum, and how Tenkan, Kijun, Senkou spans, and Chikou interact.
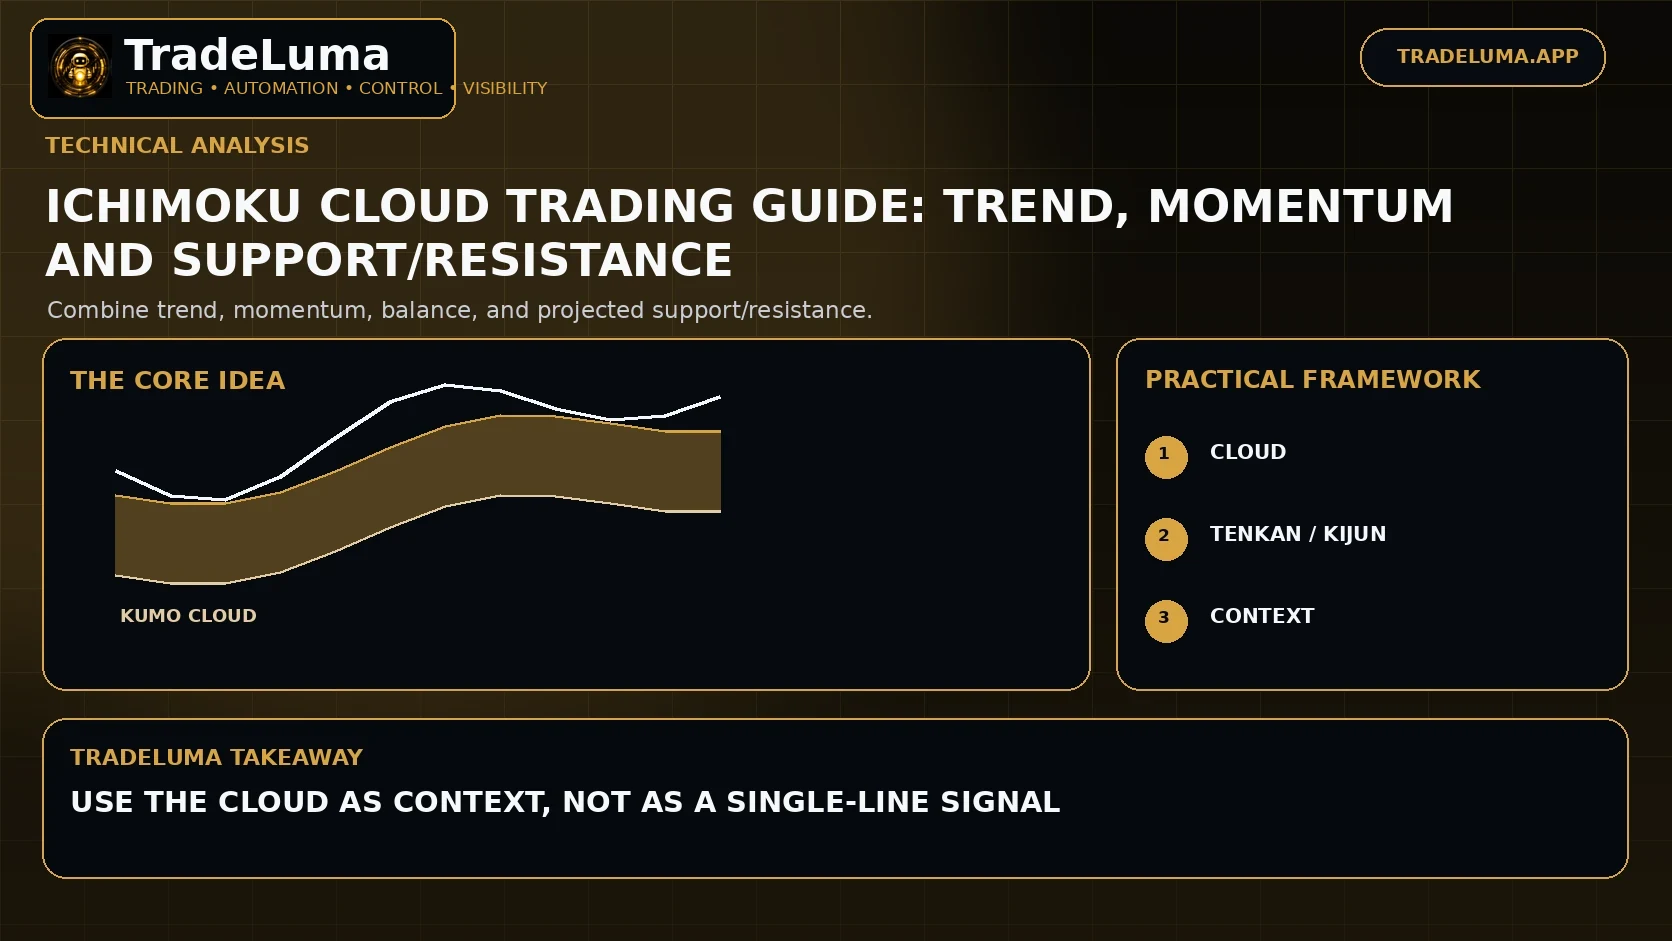
Ichimoku Kinko Hyo is a multi-part indicator designed to show trend, momentum, support, and resistance in one view. It combines midpoint calculations over different lookbacks and projects two of them forward to create the Kumo, or cloud. Because several components interact, Ichimoku can look complex at first, but each line answers a specific question about balance and direction.
The five Ichimoku components
The standard indicator includes Tenkan-sen, Kijun-sen, Senkou Span A, Senkou Span B, and Chikou Span. The first four are based on midpoint calculations over different lookbacks, while Chikou plots the current close backward.
The exact default periods were designed around historical Japanese trading schedules, so modern traders sometimes test alternative settings while preserving the relative logic.
Tenkan-sen
Tenkan-sen is the faster conversion line. It uses the midpoint of the highest high and lowest low over a shorter lookback and therefore reacts relatively quickly to changes in price balance.
Traders may use its slope and its relationship with Kijun-sen as short-term momentum information rather than treating it as a simple moving average.
Kijun-sen
Kijun-sen is the slower baseline. Because it uses a longer lookback, it often changes less frequently and can act as a reference for trend balance, pullbacks, and trailing exits.
A large distance between price and Kijun can indicate extension, but extension alone does not guarantee mean reversion.
The Kumo cloud
Senkou Span A and B form the cloud and are projected forward. The cloud shows a future reference zone based on current and historical balance. Thicker clouds are often interpreted as broader support or resistance areas.
Price above the cloud generally supports bullish context, price below supports bearish context, and price inside the cloud suggests greater uncertainty or transition.
Tenkan-Kijun crossovers
A bullish Tenkan cross above Kijun can indicate improving momentum; a bearish cross below can indicate weakening momentum. Ichimoku traders often grade the signal based on where it occurs relative to the cloud.
A bullish crossover above a bullish cloud may carry different context from the same crossover below the cloud inside a broader downtrend.
Cloud breakouts
A cloud breakout occurs when price moves from inside or below the cloud to above it, or the reverse. The setup attempts to capture a transition in trend state rather than a small short-term fluctuation.
Because the cloud can be wide, the entry and stop rules need to account for distance. Waiting for a close or retest can reduce some false breaks but creates later entries.
Chikou Span
Chikou Span plots the current close backward by the indicator's displacement period. Traders use it to compare current price with earlier price structure and to assess whether there is clear space in the direction of the trade.
It should be interpreted consistently rather than used only when it confirms a desired setup.
Ichimoku in ranges
The indicator can become noisy when price repeatedly crosses the cloud and the cloud is flat. Frequent Tenkan-Kijun crosses inside balance can produce whipsaws.
A trend filter or rule that avoids flat, overlapping cloud conditions can be useful if backtesting shows those environments are weak for the strategy.
How to test an Ichimoku strategy
Define the exact settings, cloud state, crossover or breakout rule, confirmation, stop, and exit. Test the components together and separately so you know whether each rule adds useful information.
Parameter sensitivity and out-of-sample testing are important because a visually complex indicator can invite overfitting if too many conditions are tuned.
Frequently asked questions
What is the Ichimoku Cloud?
It is the area between Senkou Span A and Senkou Span B, projected forward. Traders use it as a broad trend and support/resistance context.
What does price above the Ichimoku Cloud mean?
It generally indicates a stronger bullish context, especially when the cloud itself is rising, but it is not a complete buy signal.
What are Tenkan-sen and Kijun-sen?
Tenkan-sen is the faster conversion line and Kijun-sen is the slower baseline. Their relationship can provide momentum and trend context.
Does Ichimoku work in sideways markets?
It can generate more noise in sideways conditions because price and indicator lines repeatedly cross. Many strategies use filters to avoid flat, overlapping cloud regimes.
Continue learning
Related TradeLuma guides
Technical Analysis
ADX Indicator Explained: How to Measure Trend Strength
28 Aug 2026 · 10 min read
Technical Analysis
Fibonacci Retracement in Trading: Levels, Uses and Limitations
25 Aug 2026 · 10 min read
Technical Analysis
Support and resistance trading: how to identify key price levels
9 Aug 2026 · 12 min read
Build a controlled automation workflow with TradeLuma
Configure alerts, test in paper mode, apply execution controls, and follow broker outcomes from one workspace.