
Technical Analysis
Support and resistance trading: how to identify key price levels
Learn what support and resistance mean, how traders identify key price levels, and how breakouts, rejections, and retests can shape better trade decisions.
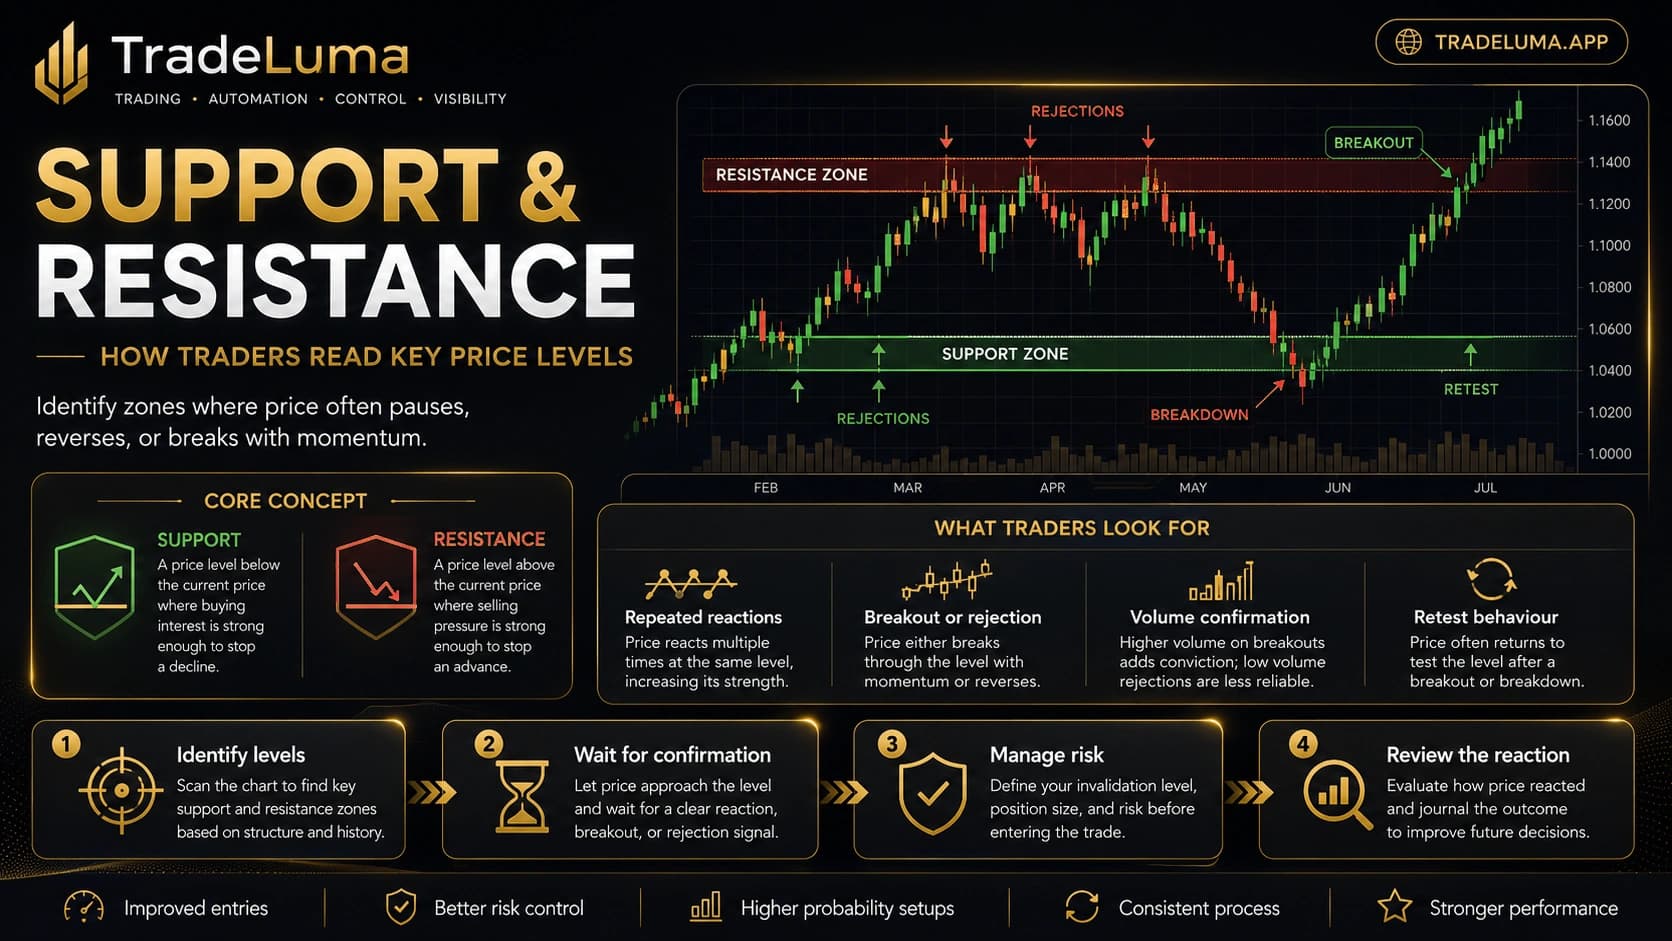
Support and resistance are among the most widely used concepts in trading because they help organise price action into practical decision points. Instead of treating every price movement as equally important, traders focus on areas where price has previously reacted, paused, reversed, or accelerated. These zones do not predict the future with certainty, but they can improve timing, structure, and risk planning when used thoughtfully.
What support and resistance mean
Support is a price area below the current market where demand has been strong enough to slow or stop a decline. Resistance is a price area above the current market where supply has been strong enough to slow or stop an advance. These reactions happen because traders often remember important prices, previous reversals, and areas of heavy activity.
In practice, support and resistance are usually zones, not perfect lines. Price may turn slightly before a level, overshoot it temporarily, or react across a small range. Thinking in zones helps traders avoid false precision and interpret the chart more realistically.
Why price reacts at key levels
Price often reacts at key levels because many participants are watching the same structure. Some are taking profit, others are entering, and some are adjusting risk. A previous swing high or swing low can become important simply because market participants remember it and respond when price returns there.
Psychology also plays a role. Traders who missed a move may wait for a return to a prior level, while traders already in profit may defend a favourable price area. These combined behaviours can create repeated reactions that become visible on the chart.
How traders identify support and resistance
Common methods include marking recent swing highs and lows, prior consolidation areas, repeated turning points, round numbers, and areas where volume was unusually active. The best levels are usually visible without forcing them. If the chart needs too much imagination, the level may not be important enough to trade around.
Multiple touches often strengthen a zone because they show that price has reacted there more than once. However, the context still matters. A level that formed in a strong trend may behave differently from a level inside a choppy range.
Breakouts, rejections, and retests
When price approaches resistance, traders may watch for rejection if the market fails to break through and moves lower again. If price closes decisively above the area, the event may be treated as a breakout. The same logic applies in reverse when price approaches support.
Retests are especially important. After a breakout, price often returns to the broken level before continuing. A former resistance can act as support, and a former support can act as resistance. This behaviour can help traders confirm whether the break was accepted by the market or quickly rejected.
Use support and resistance with volume and context
A level becomes more meaningful when the reaction happens with supporting context. Higher volume on a breakout may suggest stronger participation, while weak volume can make the move less convincing. Trend direction, session timing, and the broader market structure also affect how a level should be interpreted.
For example, a breakout in the direction of a strong trend is often treated differently from a breakout against the dominant trend. Context helps traders avoid using support and resistance as isolated signals.
Common mistakes when trading key levels
One common mistake is treating a level as certain to hold. Even good zones fail regularly. Another is drawing too many lines until every price area looks important. That usually reduces clarity instead of improving it. Traders can also make the mistake of entering too early without waiting for the market to show whether it will reject, break, or retest the area.
Poor risk planning is another problem. A level may be valid, but if the stop placement, reward potential, or position size are poor, the trade may still be low quality. Good chart reading should support disciplined decisions rather than replace them.
How support and resistance improve trade planning
Support and resistance can improve trade planning by giving structure to entries, stops, and targets. A trader may define the trade idea around how price behaves at a level instead of reacting emotionally after the move has already started. This often creates more logical invalidation points and clearer reward expectations.
That structure can also help with journaling and review. After the trade, the trader can assess whether the level was drawn well, whether the reaction matched the plan, and whether the execution followed the intended process.
The goal is probability, not prediction
Support and resistance do not tell traders exactly what will happen next. Their value is that they highlight areas where a meaningful reaction is more likely. Used properly, they help the trader prepare several possibilities rather than become attached to a single outcome.
The practical mindset is simple: identify the level, wait for evidence, manage the risk, and review the result. That approach makes support and resistance a planning tool rather than a source of false certainty.
Frequently asked questions
What is support in trading?
Support is a price area where buying interest may be strong enough to slow or stop a decline. It is usually better thought of as a zone than a perfect line.
What is resistance in trading?
Resistance is a price area where selling pressure may be strong enough to slow or stop an advance. Like support, it is usually a zone rather than an exact single price.
What is a retest after a breakout?
A retest happens when price returns to a recently broken level to test whether it now acts in the opposite role, such as old resistance becoming new support.
Can support and resistance guarantee a reversal?
No. These levels highlight areas of interest, not certainty. Breakouts, failures, and false breaks are all possible, so traders still need confirmation and risk control.
Continue learning
Related TradeLuma guides
Technical Analysis
Fibonacci Retracement in Trading: Levels, Uses and Limitations
25 Aug 2026 · 10 min read
Technical Analysis
Ichimoku Cloud Trading Guide: Trend, Momentum and Support/Resistance
10 Sept 2026 · 12 min read
Technical Analysis
Divergence Trading Guide: RSI, MACD and Price Divergence Explained
12 Sept 2026 · 11 min read
Build a controlled automation workflow with TradeLuma
Configure alerts, test in paper mode, apply execution controls, and follow broker outcomes from one workspace.