
Technical Analysis
Stochastic Oscillator Explained: Overbought, Oversold and Crossovers
Learn how the stochastic oscillator compares the close with the recent trading range, how %K and %D work, and how traders use it in trends and ranges.
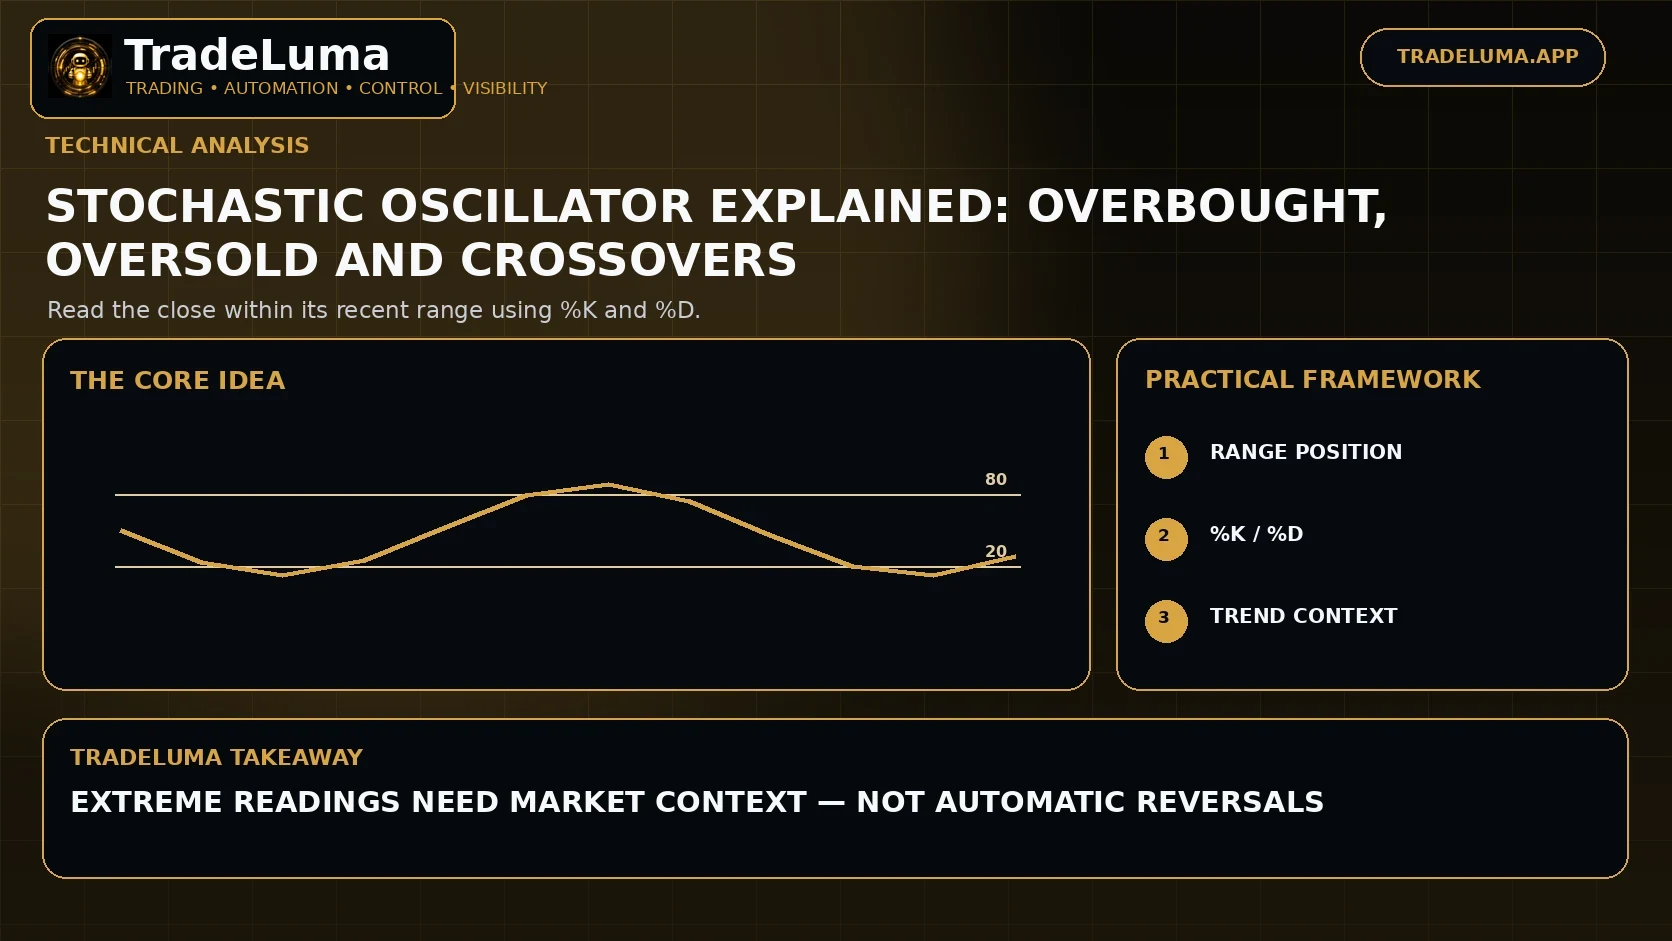
The stochastic oscillator measures where the latest close sits within the recent high-low range. The idea is that strong upward momentum often closes nearer the top of the range while strong downward momentum often closes nearer the bottom. Readings are bounded between 0 and 100, making the indicator popular for overbought, oversold, crossover, and divergence analysis. The main limitation is that strong trends can keep the oscillator at an extreme for a long time.
How the stochastic oscillator works
The core calculation compares the current close with the lowest low and highest high over a chosen lookback. A close near the top of the range produces a high reading; a close near the bottom produces a low reading.
The standard settings vary by platform, so traders should confirm whether they are using fast, slow, or full stochastic calculations before comparing results.
Understanding %K and %D
%K is the primary oscillator line. %D is usually a moving average of %K and acts as a smoother signal line. Crossovers between the two can highlight changes in short-term momentum.
Because crossovers can happen frequently in choppy markets, many strategies add price structure or trend filters rather than trading every intersection.
Overbought and oversold
Readings above 80 are commonly called overbought and readings below 20 oversold. These labels mean price is closing near one end of the recent range; they do not mean price must reverse.
In a strong uptrend, stochastic can remain overbought while price continues rising. Selling only because the reading is high can therefore fight the trend.
Stochastic in range-bound markets
The indicator often makes intuitive sense in a range because price repeatedly rotates from one side to the other. A trader may look for oversold readings near range support and overbought readings near range resistance.
Location matters. An oversold reading in the middle of a range carries less structural information than the same reading after price tests a well-defined lower boundary.
Using stochastic in trends
Trend traders can use the oscillator differently: instead of fading overbought conditions, they may wait for a bullish trend to pull the oscillator down and then turn back up as price forms a higher low.
The opposite applies in downtrends. This treats stochastic as a pullback timing tool rather than a reversal signal.
Crossovers and confirmation
A %K cross above %D can indicate improving short-term momentum; a cross below can indicate weakening momentum. The significance depends on where the crossover occurs and what price is doing.
A strategy may require the crossover to occur outside an extreme zone, near structure, or in the direction of the higher-timeframe trend.
Stochastic divergence
Bullish divergence occurs when price makes a lower low while the oscillator makes a higher low. Bearish divergence is the opposite. Divergence can signal slowing momentum, but it can persist before price reverses.
Treat divergence as context and define a separate price trigger rather than assuming the first divergence point is the exact turning point.
Settings and sensitivity
A shorter lookback reacts faster and generates more signals, while a longer lookback is smoother. Additional smoothing reduces noise but adds lag.
There is no universally best setting. Parameter sensitivity testing can show whether the strategy is robust across nearby values or depends on one exact combination.
How to backtest stochastic rules
Define the lookback, smoothing, threshold, crossover condition, trend filter, entry, stop, and exit. Then test across trend and range regimes rather than selecting only attractive examples.
Include transaction costs because oscillators can generate frequent signals in sideways markets.
Frequently asked questions
What does the stochastic oscillator measure?
It measures where the latest close sits within the recent high-low range and expresses that location on a 0-to-100 scale.
Is stochastic above 80 a sell signal?
No. Above 80 only indicates that price is closing near the upper part of the recent range. Strong trends can remain above 80 for extended periods.
What are %K and %D?
%K is the faster stochastic line and %D is usually a smoothed average of %K used as a signal line.
Is stochastic better than RSI?
Neither is universally better. They use different calculations and can behave differently by market regime, so the useful choice depends on the tested strategy.
Continue learning
Related TradeLuma guides
Technical Analysis
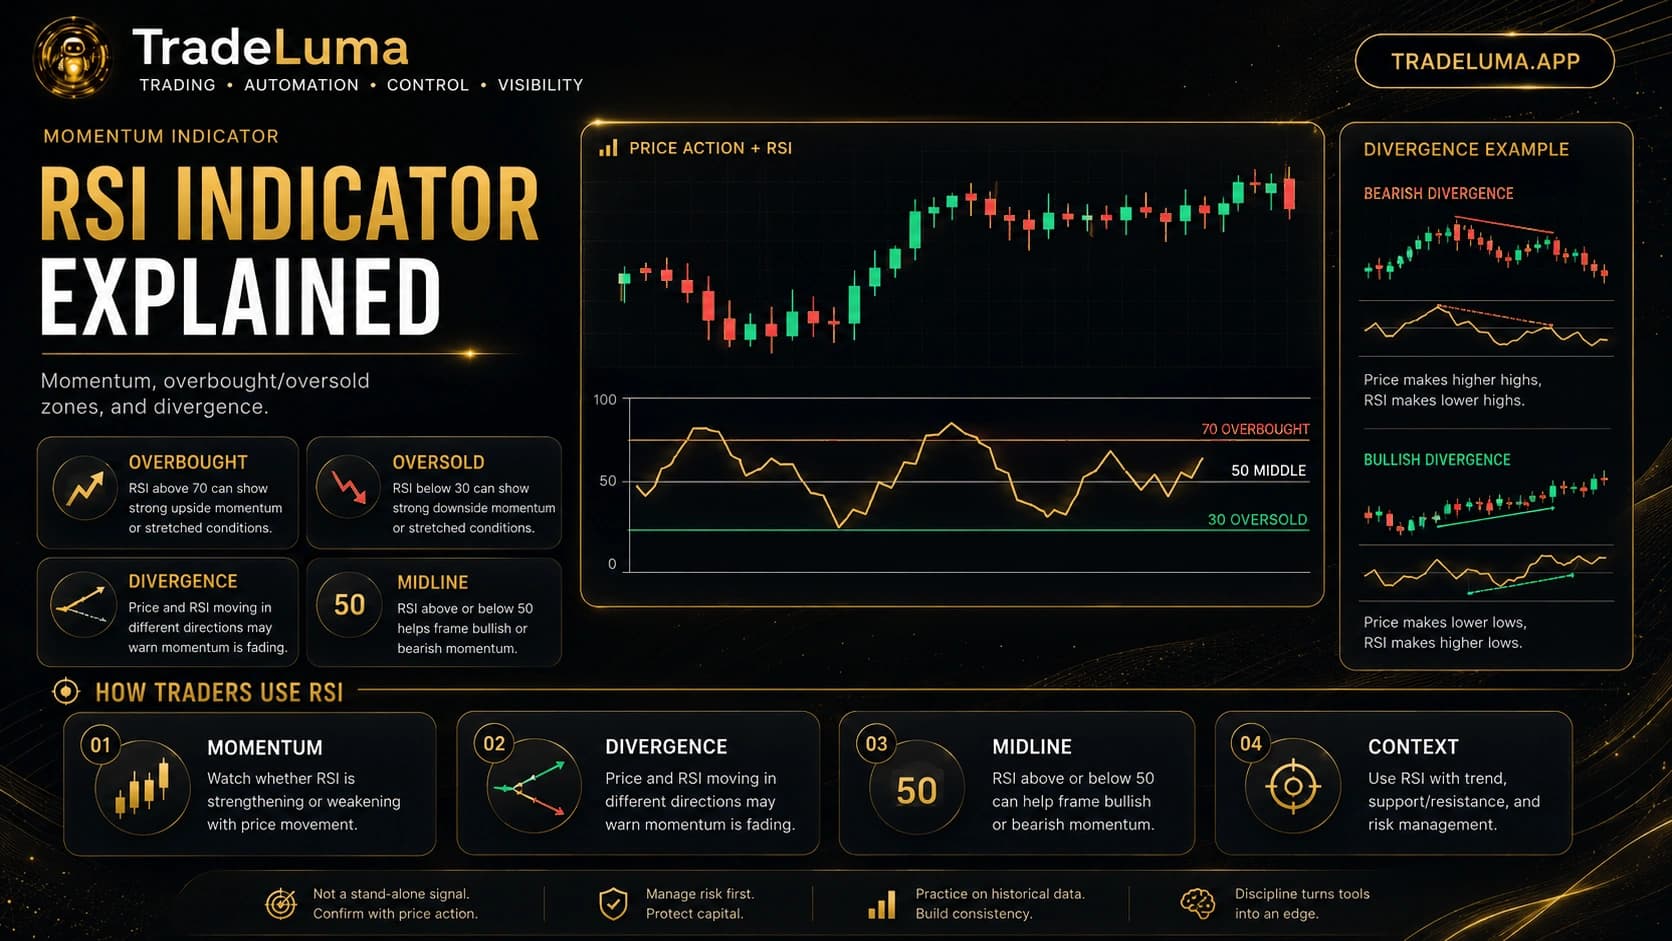
RSI indicator explained: overbought, oversold, and divergence
9 Aug 2026 · 12 min read
Technical Analysis
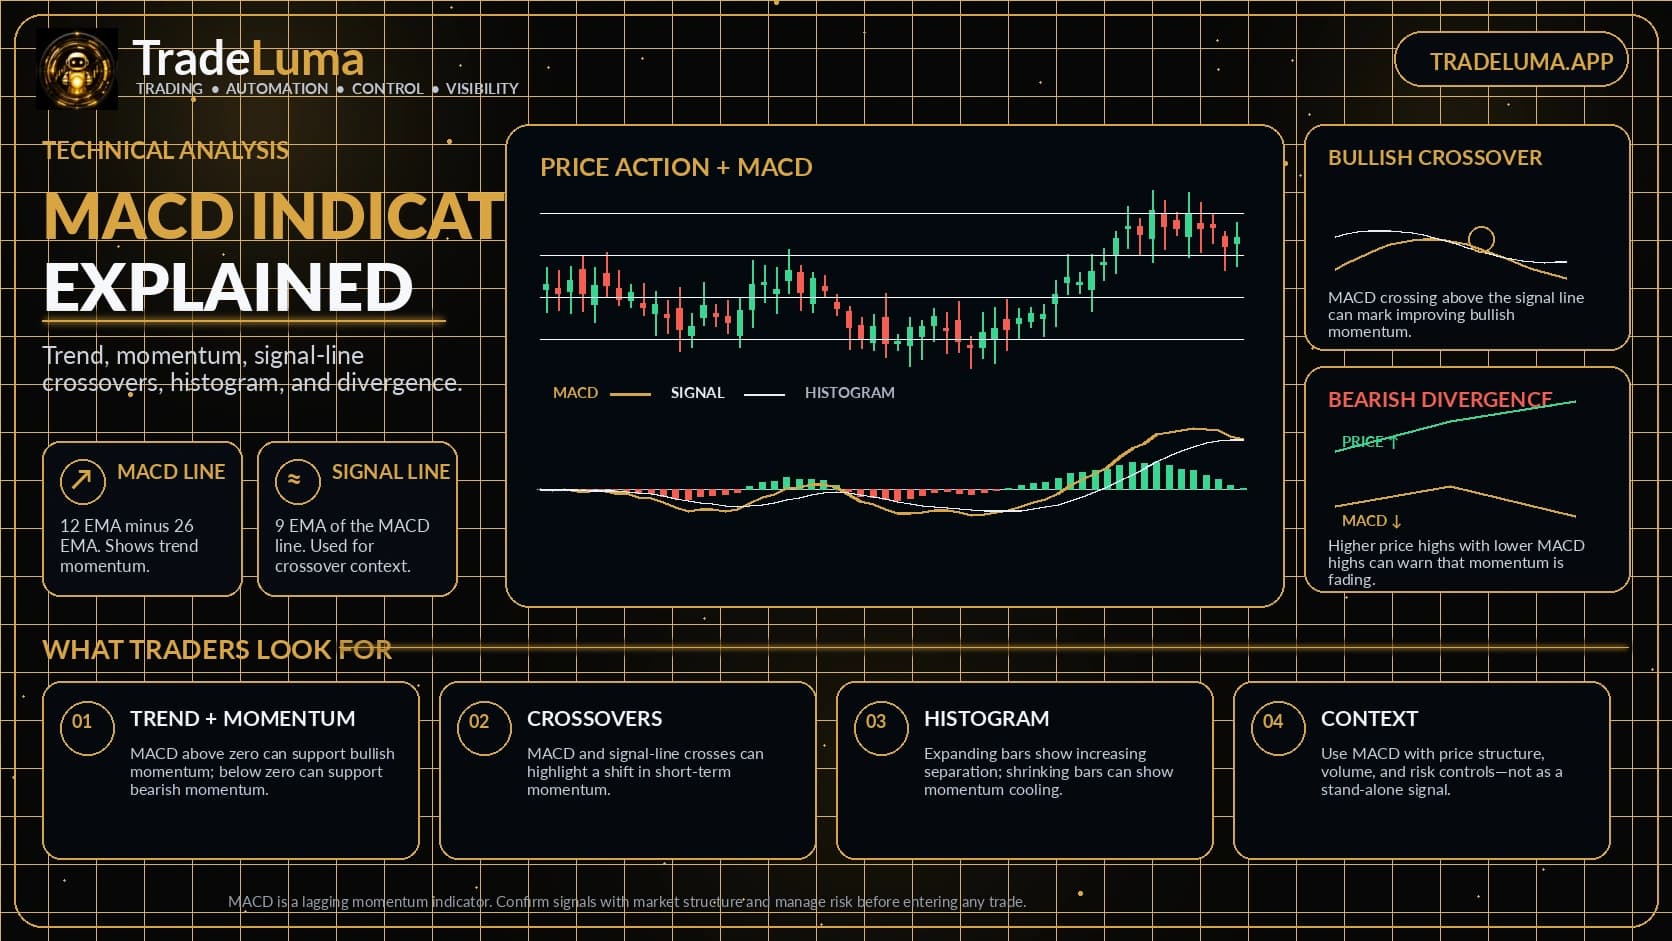
MACD indicator explained: signal line, histogram & crossovers
10 Aug 2026 · 12 min read
Technical Analysis
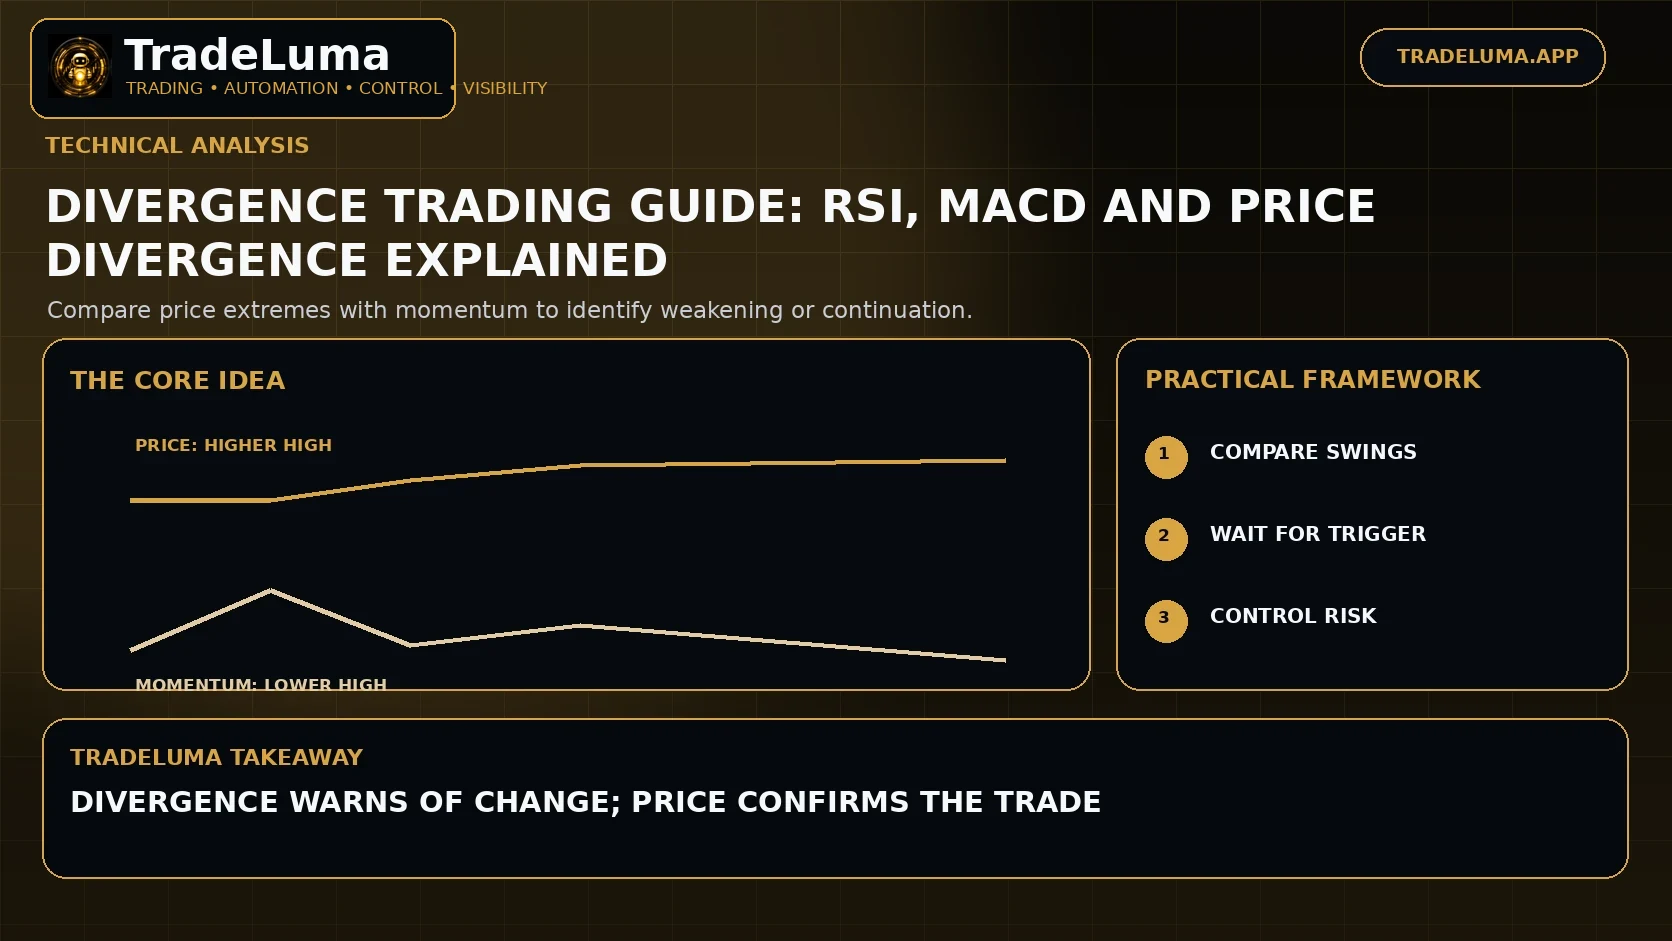
Divergence Trading Guide: RSI, MACD and Price Divergence Explained
12 Sept 2026 · 11 min read
Build a controlled automation workflow with TradeLuma
Configure alerts, test in paper mode, apply execution controls, and follow broker outcomes from one workspace.