
Technical Analysis
RSI indicator explained: overbought, oversold, and divergence
Learn how the RSI indicator works, what overbought and oversold levels mean, how traders use the 50 line, and how RSI divergence can signal momentum shifts.
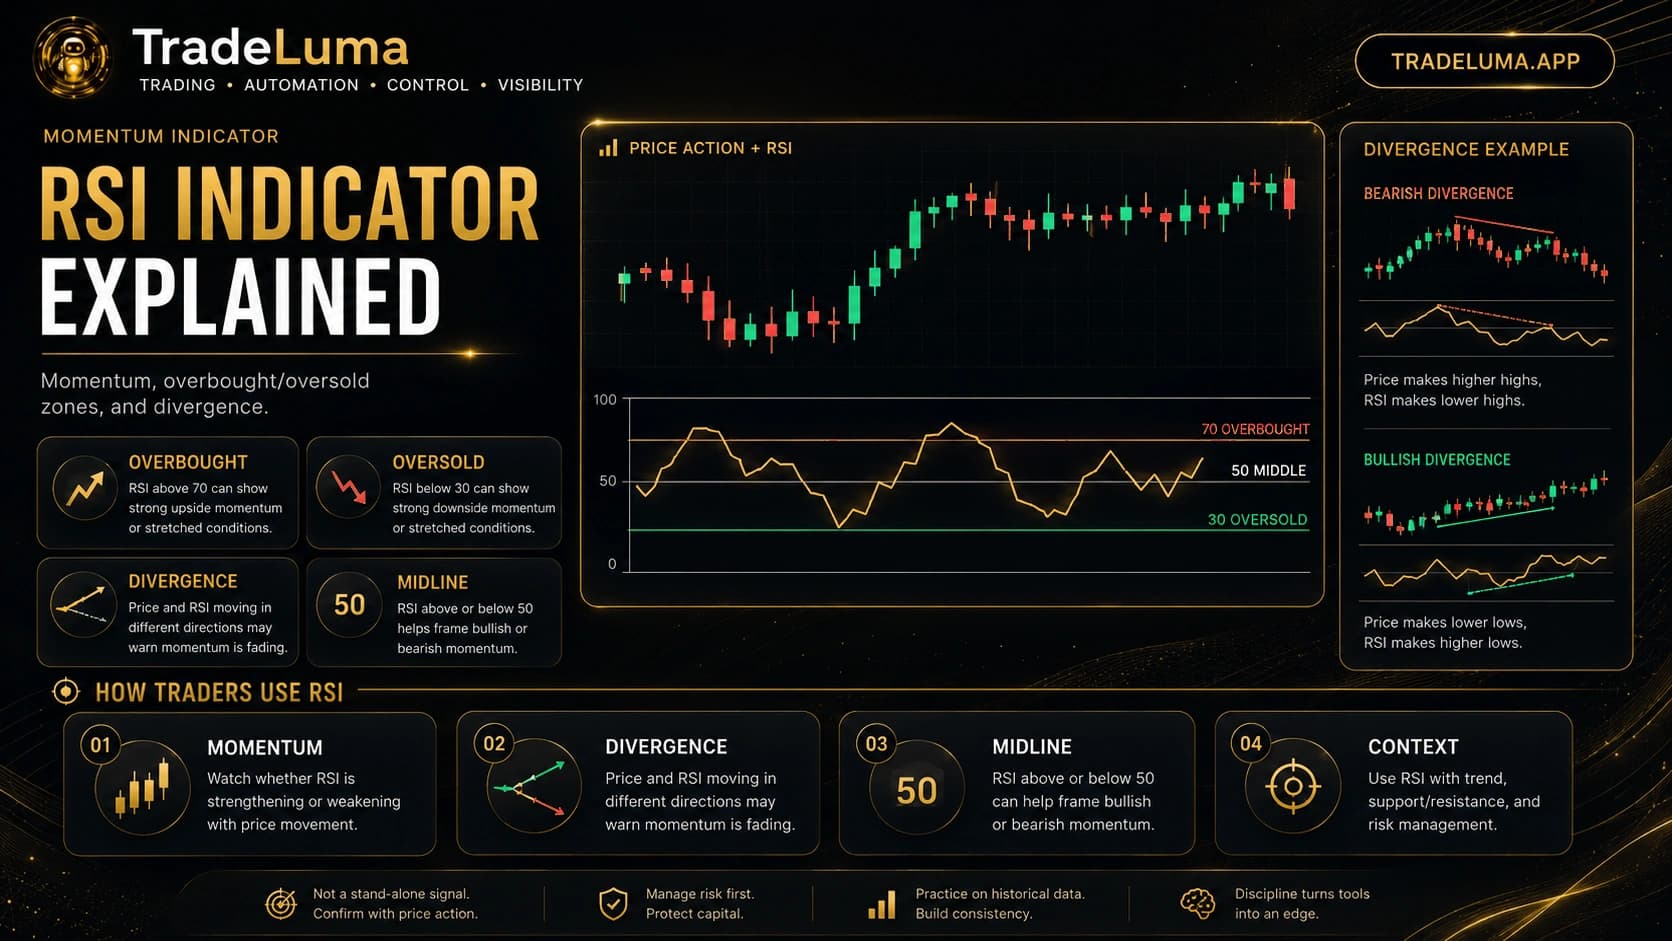
The Relative Strength Index, usually called RSI, is a momentum indicator that moves between 0 and 100. Traders use it to judge how strongly price has been moving, identify unusually stretched conditions, and compare momentum with the direction of price. The familiar 70 and 30 levels are often labelled overbought and oversold, but RSI is more useful when those levels are treated as context rather than automatic reversal signals.
What the RSI indicator measures
RSI compares the strength of recent positive price changes with recent negative price changes and converts that relationship into a value between 0 and 100. A higher reading means recent upward movement has been stronger, while a lower reading means downward movement has been stronger.
The standard lookback is often 14 periods, but traders can change it. A shorter setting reacts faster and can become more sensitive to noise. A longer setting moves more slowly and may suit traders looking for broader momentum rather than quick signals.
What overbought and oversold really mean
An RSI reading above 70 is commonly called overbought, and a reading below 30 is commonly called oversold. These labels do not mean price must immediately reverse. They mean recent momentum has become unusually strong relative to the indicator's calculation.
In strong uptrends, RSI can remain above 70 or repeatedly return there while price continues higher. In strong downtrends, RSI can remain below 30 while price keeps falling. Traders who automatically fade every extreme can therefore end up trading against powerful momentum.
How traders use the RSI 50 midline
The 50 level can be a useful way to simplify momentum. RSI holding mostly above 50 can support a bullish momentum view, while RSI remaining mostly below 50 can support a bearish one. Crosses of the midline may help show when momentum is changing even if the indicator never reaches 70 or 30.
This approach is especially useful in trends because it focuses less on reversal and more on whether momentum is staying aligned with the prevailing direction.
RSI divergence explained
Divergence occurs when price and RSI stop moving in the same direction. A bearish divergence can form when price makes a higher high while RSI makes a lower high, suggesting upward momentum is not confirming the new price extreme. A bullish divergence can occur when price makes a lower low while RSI makes a higher low.
Divergence is a warning, not a guaranteed reversal. Momentum can diverge for several swings before price changes direction. Traders often wait for structure, a break, or another confirmation instead of entering only because divergence appeared.
RSI works differently in trends and ranges
In a range, overbought and oversold readings may be more useful because price is repeatedly rotating between boundaries. In a strong trend, the same readings can represent continuation rather than exhaustion. That difference is one reason the broader market structure should be identified before interpreting RSI.
Some traders also watch the range of RSI itself. In bullish conditions the indicator may spend more time between roughly 40 and 80, while bearish conditions may keep it closer to the lower half. These are observations rather than fixed rules and should be tested for the market being traded.
Common mistakes when using RSI
The most common mistake is assuming 70 means sell and 30 means buy. Another is adjusting the indicator repeatedly until historical signals look perfect. Traders can also focus on tiny divergences that are not connected to meaningful price structure.
RSI should simplify the decision process, not create dozens of reasons to enter. A clear use case—such as trend confirmation, pullback timing, or momentum divergence—is usually more useful than trying to make one oscillator explain everything.
Combining RSI with price structure
RSI becomes more informative when it agrees with what price is doing. An oversold reading near a meaningful support zone may be worth more attention than an oversold reading in the middle of a strong breakdown. A bearish divergence near resistance may be more useful than one formed at an unimportant price area.
Volume, trend direction, candlestick behaviour, and moving averages can add further context. The goal is not to collect indicators until they all agree, but to use a small number of independent clues that answer different questions.
Use RSI as a momentum tool, not a prediction machine
RSI is valuable because it makes momentum visible in a consistent way. It can show whether a move is accelerating, weakening, or becoming stretched and can highlight when price and momentum are telling different stories.
The indicator cannot know where the next reversal will happen. Traders still need a plan for entry, invalidation, size, and exit. Used with that structure, RSI can improve context without creating false certainty.
Frequently asked questions
What does RSI stand for?
RSI stands for Relative Strength Index. It is a momentum oscillator that converts recent price strength into a value between 0 and 100.
Is RSI above 70 always a sell signal?
No. RSI above 70 indicates strong recent upside momentum or stretched conditions, but strong trends can remain overbought for a long time.
What is RSI divergence?
RSI divergence occurs when price makes a new extreme but RSI does not confirm it. Traders may treat that as a warning that momentum is weakening, not as a guaranteed reversal.
What is the RSI 50 level used for?
The 50 line can help frame momentum. RSI holding above 50 often supports bullish momentum, while readings mostly below 50 can support bearish momentum.
Continue learning
Related TradeLuma guides
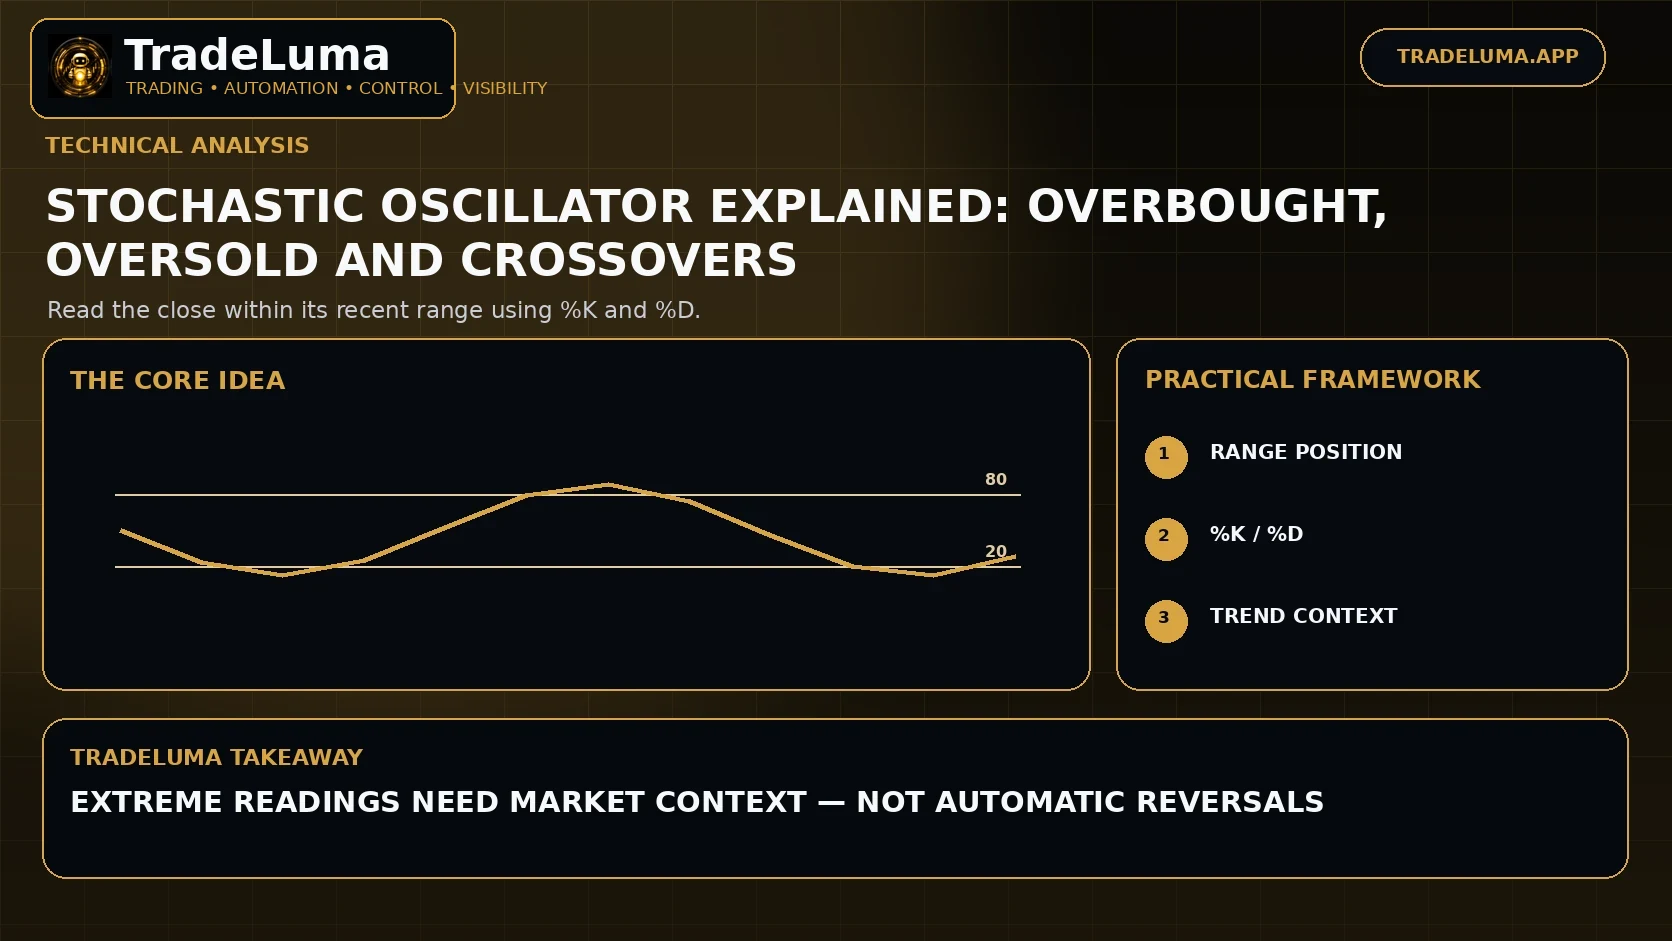
Technical Analysis
Stochastic Oscillator Explained: Overbought, Oversold and Crossovers
9 Sept 2026 · 10 min read
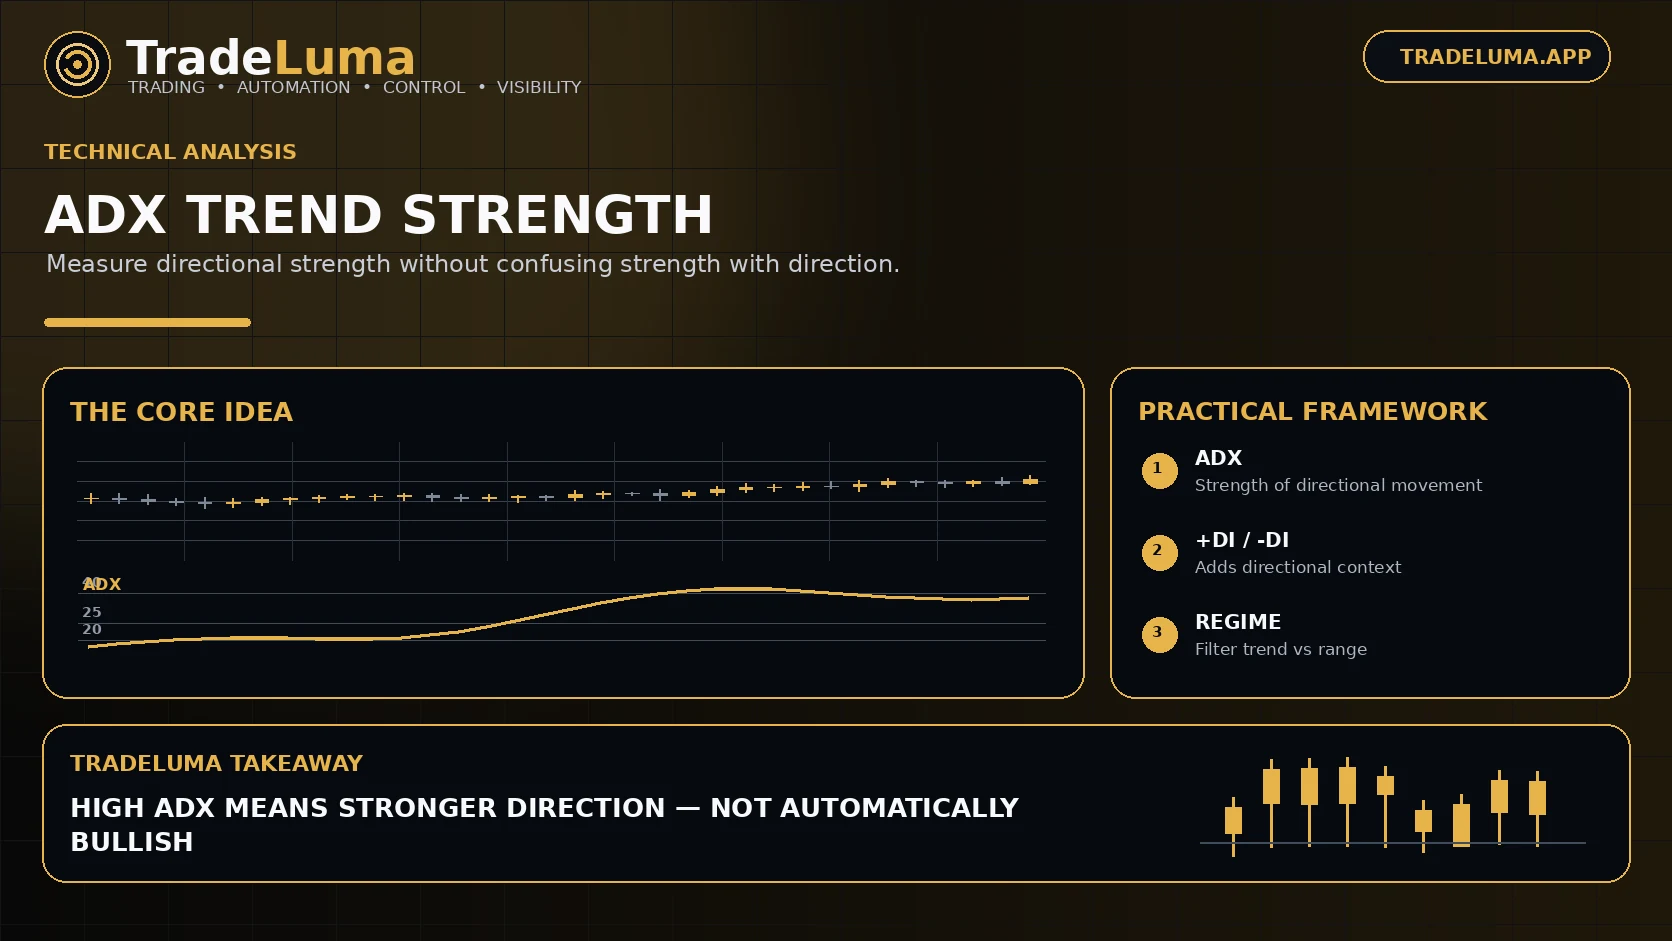
Technical Analysis
ADX Indicator Explained: How to Measure Trend Strength
28 Aug 2026 · 10 min read
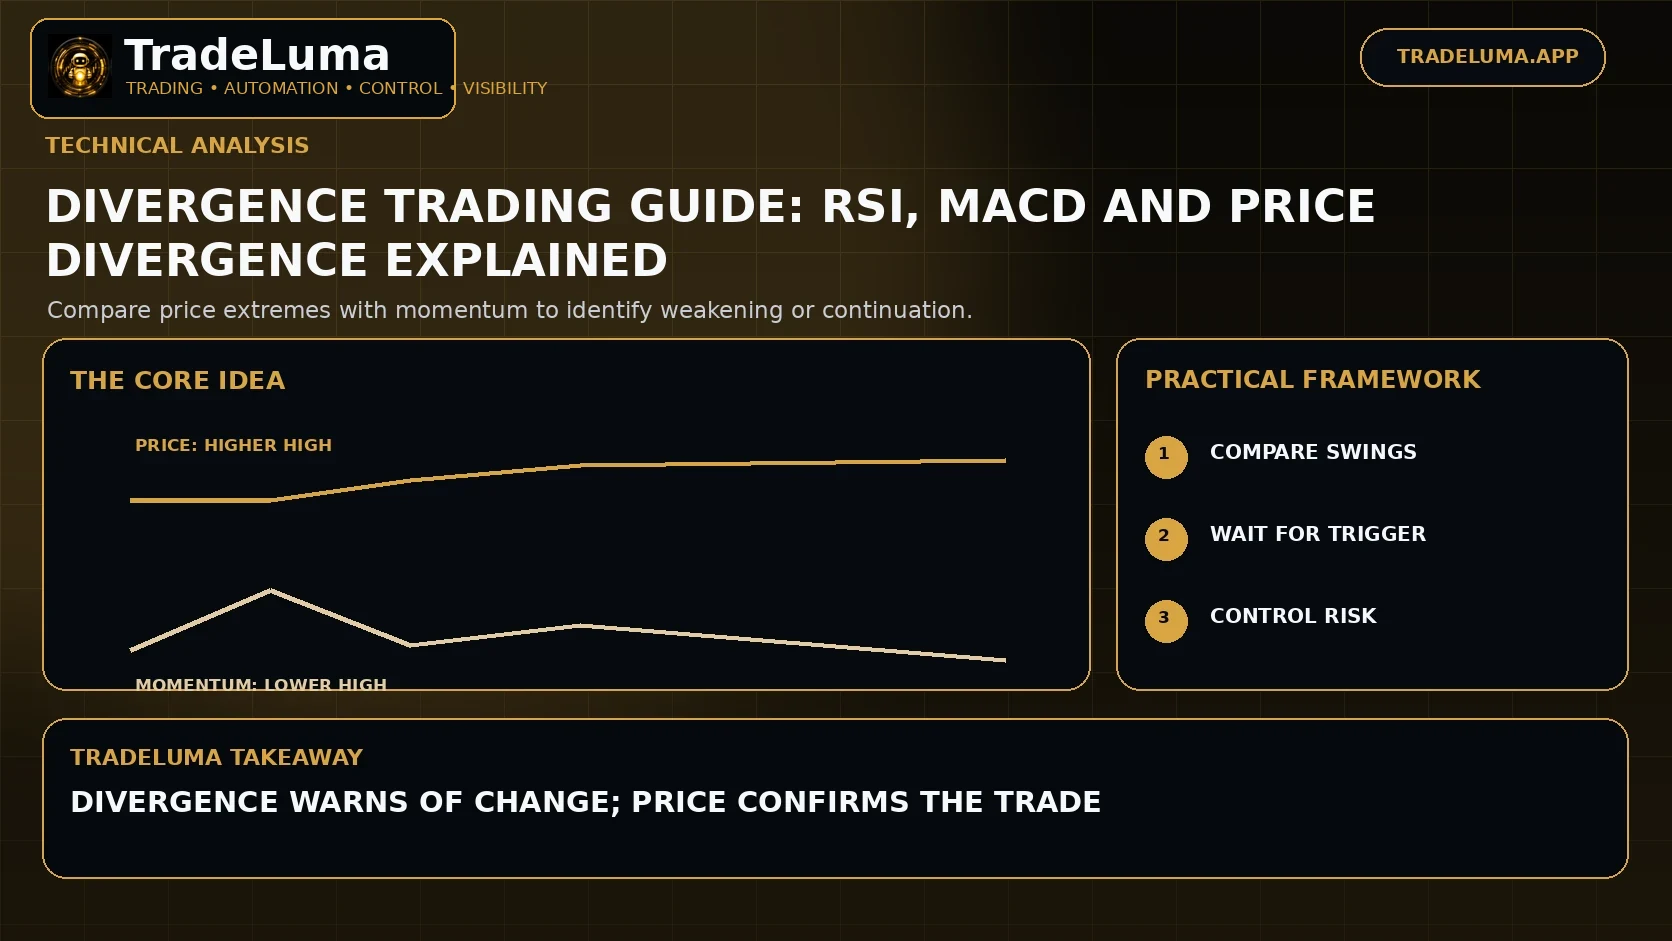
Technical Analysis
Divergence Trading Guide: RSI, MACD and Price Divergence Explained
12 Sept 2026 · 11 min read
Build a controlled automation workflow with TradeLuma
Configure alerts, test in paper mode, apply execution controls, and follow broker outcomes from one workspace.