
Technical Analysis
Liquidity Sweeps in Trading: Stop Runs, Reclaims and False Breaks Explained
Learn how traders identify liquidity sweeps around obvious highs and lows, distinguish them from breakouts, and combine reclaims with structure and risk.
On this page+
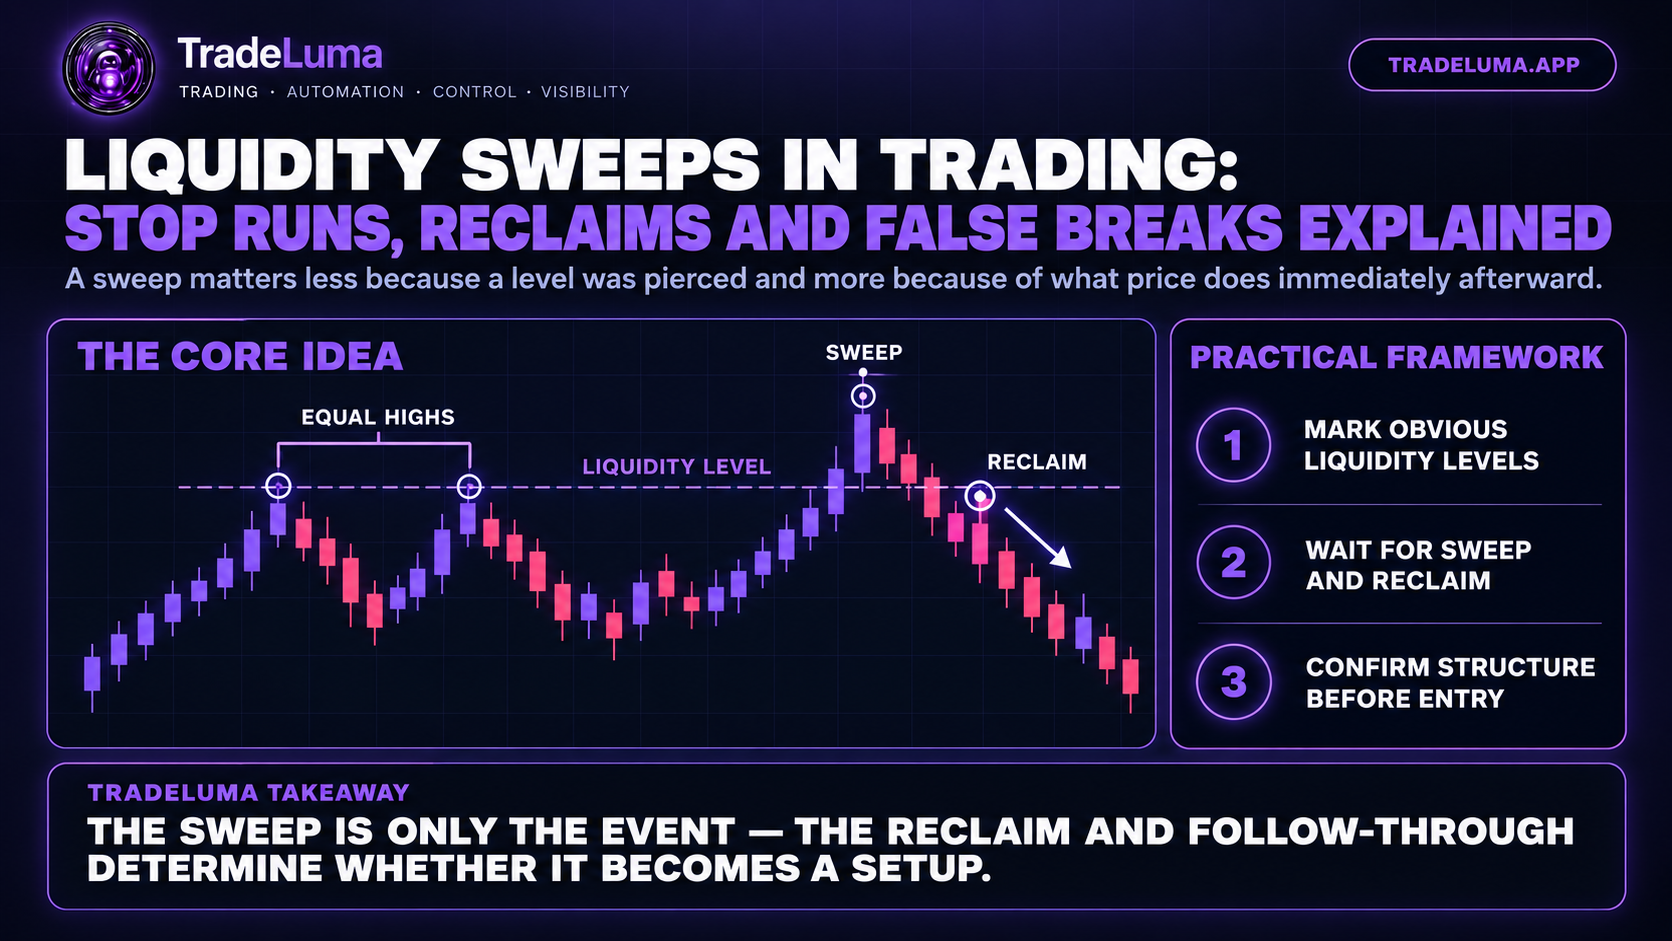
Liquidity sweeps describe a common chart event where price briefly moves beyond an obvious high or low and then returns back through the level. Traders often use the pattern to study false breakouts, stop runs, and the behaviour that follows crowded technical levels. The move does not prove deliberate manipulation or reveal who triggered it; the useful information comes from the visible sequence of level, break, reclaim, and follow-through.
What is a liquidity sweep in trading?
A liquidity sweep is a chart pattern where price moves through an obvious high or low, trades into the area beyond it, and then returns back across the level. The move is sometimes called a liquidity grab, stop run, or stop hunt, although those labels can imply intent that a chart alone cannot prove.
The practical idea is simpler: obvious levels often attract orders. Traders with existing positions may place stops beyond them, while breakout traders may place new entries in the same area. When price trades through the level, that cluster of orders can contribute to a burst of activity.
Where traders look for liquidity
Common reference points include equal highs, equal lows, prior session highs and lows, range boundaries, recent swing points, and widely watched support or resistance. These are not guaranteed pools of orders, but they are visible locations where many trading plans naturally place entries or stops.
The more obvious the level, the easier it is to define the pattern consistently. A vague level chosen after the reversal makes the setup difficult to test. Traders who use sweep logic often mark candidate liquidity before price reaches it.
Liquidity sweep versus genuine breakout
The key difference is what happens after price moves through the level. A sweep usually shows rejection or a quick reclaim back inside the prior range. A genuine breakout tends to spend more time beyond the level, close with strength, and build new structure outside the old boundary.
There is no perfect real-time test. Some true breakouts retest the old level before continuing, while some apparent sweeps reclaim briefly and then break again. That uncertainty is why confirmation and invalidation rules are necessary.
Why the reclaim matters
A wick through a prior high or low can be caused by ordinary volatility. Traders often wait for a candle close back through the level, a lower-timeframe structural shift, or a decisive move away before they classify the event as a usable sweep.
The reclaim changes the information set because price has shown that trading beyond the level was not immediately accepted. It still does not guarantee reversal, but it gives the trader a clearer point from which to define the setup.
Combining sweeps with market structure
Liquidity sweeps become more selective when they are aligned with broader structure. For example, a sweep of a recent low inside a higher-timeframe uptrend may be interpreted differently from the same pattern inside a strong downtrend.
Traders may also combine the sweep with a fair value gap, order block, support or resistance zone, or breakout-retest level. The purpose should be to reduce ambiguity, not to add enough labels that every historical reversal appears obvious.
Entry and stop approaches
Aggressive traders may enter as soon as the level is reclaimed. More conservative traders may wait for a new swing, a displacement candle, or a pullback after the reclaim. Each approach changes the entry price, stop distance, and probability of missing the move.
Stops are often placed beyond the extreme of the sweep or beyond the structural level that would invalidate the setup. Position size should then be calculated from the actual cash risk rather than from how attractive the chart pattern appears.
Timing and volatility
Sweep patterns can look different across sessions and volatility regimes. A small probe beyond a level during quiet trading may mean something different from a large spike around an economic release, market open, or sudden change in liquidity.
A robust strategy should decide whether certain sessions, news windows, or volatility conditions are included or excluded. Otherwise, the same label may be applied to market environments that behave very differently.
Common liquidity-sweep mistakes
One mistake is assuming every stop-out followed by a reversal was a deliberate stop hunt. Another is entering simply because a wick exceeded a prior high or low without waiting for reclaim or follow-through.
Traders can also confuse a strong breakout with a sweep because they want to fade the move. The invalidation rule matters: if price accepts beyond the level and continues building structure there, the original sweep thesis may no longer apply.
How to backtest liquidity sweeps
Define the liquidity level before the event, then specify how far price is allowed to trade beyond it, how quickly it must reclaim, what confirmation is required, where the stop sits, and how the target is chosen. Those rules turn a visual idea into a testable setup.
Track how often candidate levels are swept, how often they reclaim, how often reclaimed levels reverse versus break again, and how performance changes by market, timeframe, session, and volatility. This helps separate a repeatable pattern from memorable chart examples.
Frequently asked questions
What is a liquidity sweep?+
It is a chart event where price trades beyond an obvious high or low and then returns back through the level, often creating a false-break or stop-run appearance.
Is a liquidity sweep the same as a stop hunt?+
The terms are often used interchangeably, but 'stop hunt' can imply deliberate intent. A chart can show the sweep and reclaim, but not necessarily who caused it or why.
How is a liquidity sweep different from a breakout?+
A sweep typically rejects or reclaims the broken level, while a breakout is more likely to show acceptance and continuation outside the prior range.
Where do traders look for liquidity sweeps?+
Common areas include equal highs and lows, prior session extremes, range boundaries, swing points, and widely watched support or resistance levels.
Technical analysis
Continue with the topic hub.
Browse the related TradeLuma guides and build the topic from foundations through practical application.
Explore Technical analysis guides →Continue learning
Related guides.
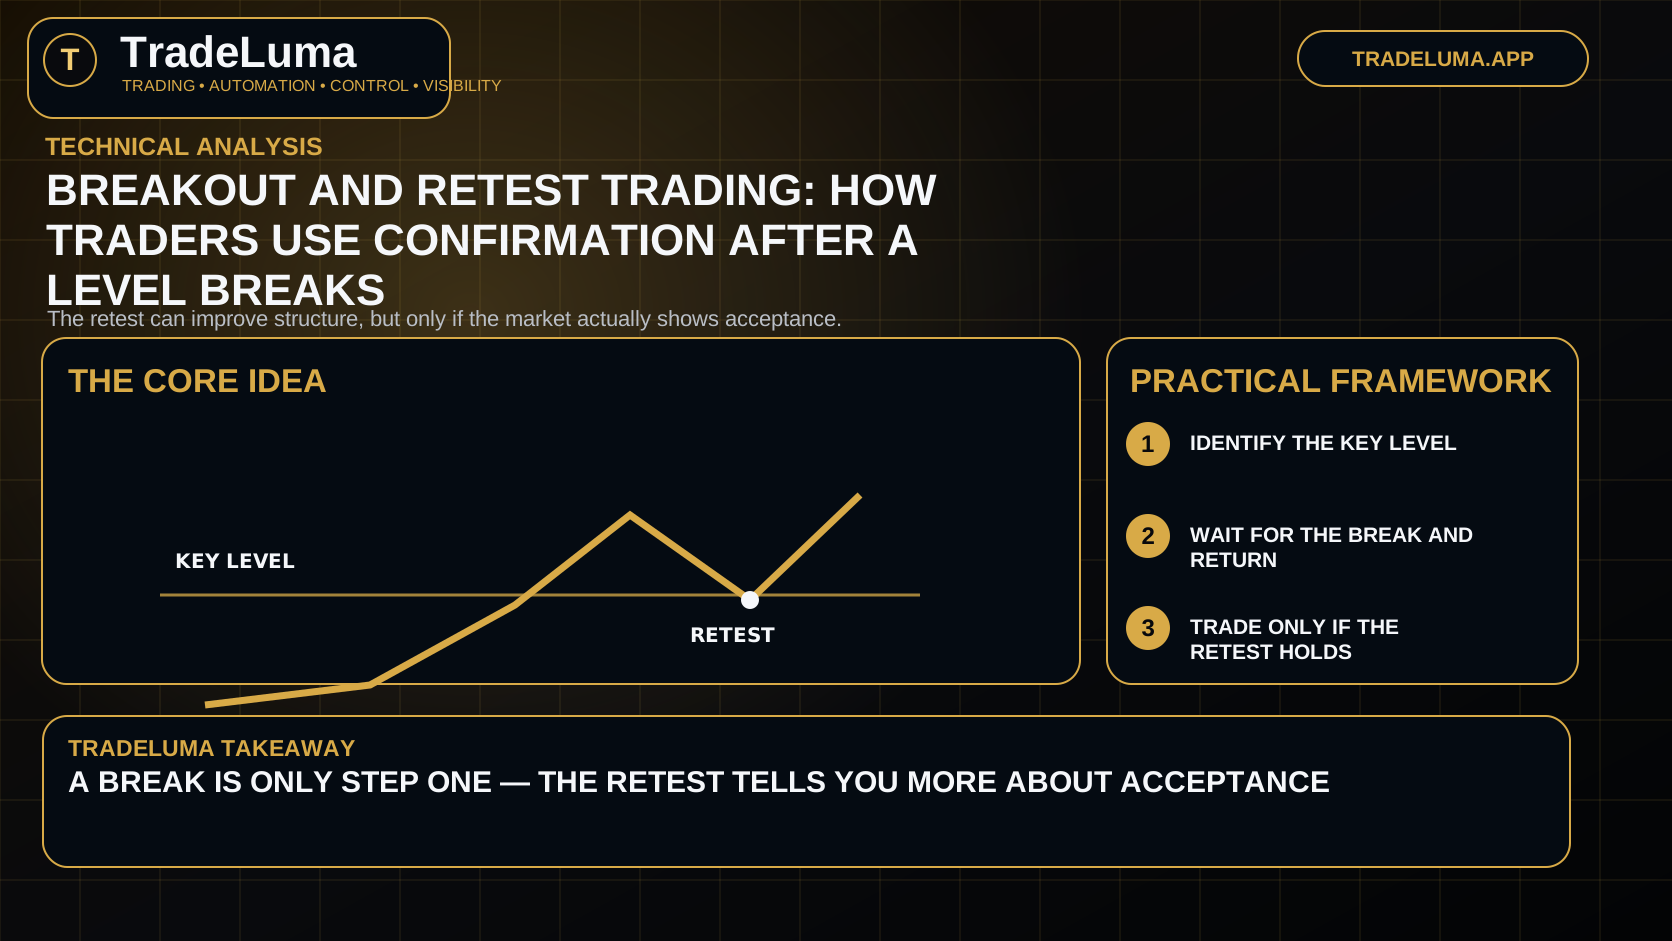
Breakout and retest trading: how traders use confirmation after a level breaks
Learn what a breakout and retest setup is, why many traders prefer it, and how to avoid confusing every pullback with confirmation.
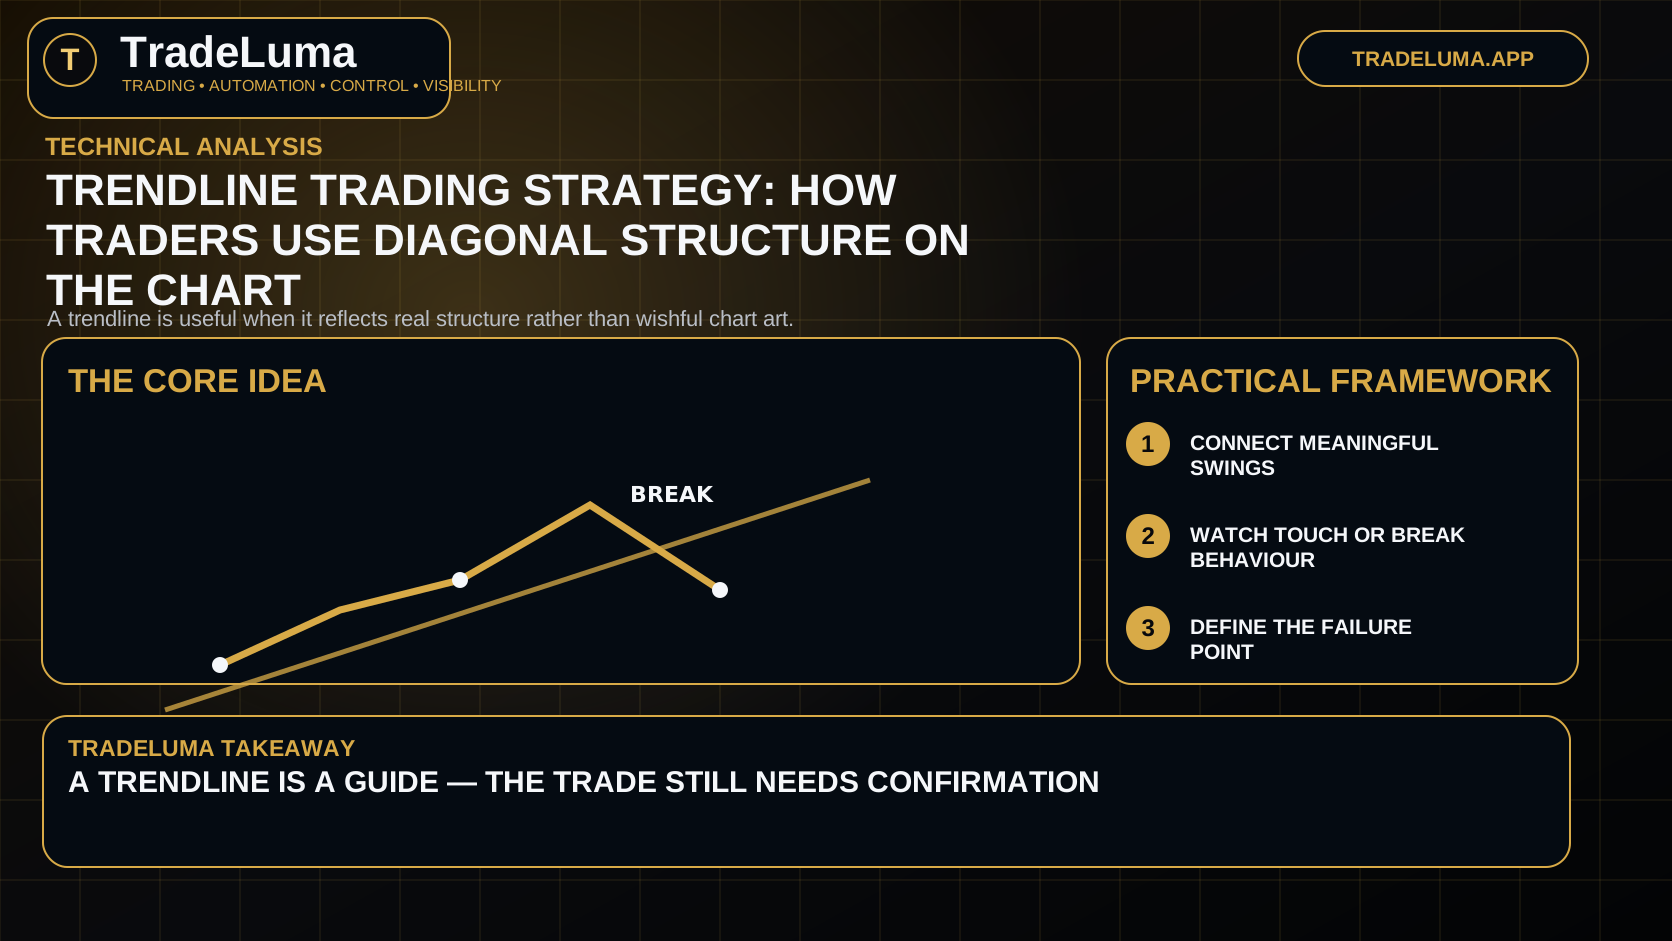
Trendline trading strategy: how traders use diagonal structure on the chart
Learn how trendlines are drawn, what they can and cannot do, and how to use them with structure, entries, and invalidation.
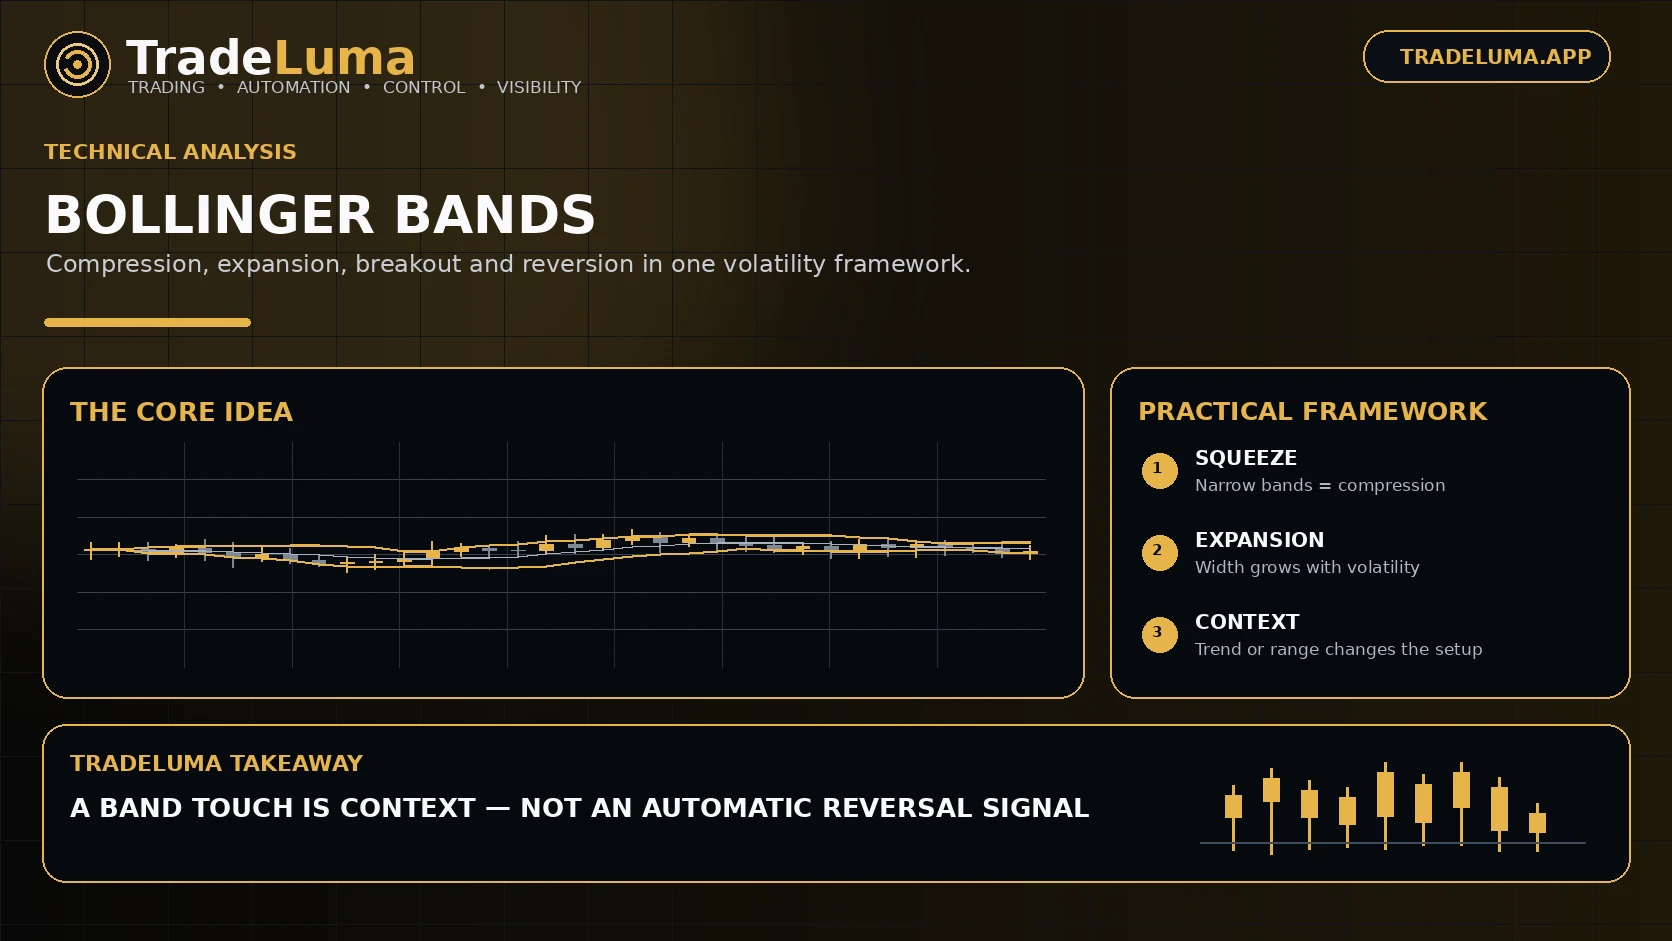
Bollinger Bands Trading Guide: Squeezes, Breakouts and Mean Reversion
Learn how Bollinger Bands measure relative price and volatility, what a squeeze can indicate, and how traders use the bands for breakouts and mean-reversion setups.