
Technical Analysis
Trendline trading strategy: how traders use diagonal structure on the chart
Learn how trendlines are drawn, what they can and cannot do, and how to use them with structure, entries, and invalidation.
On this page+
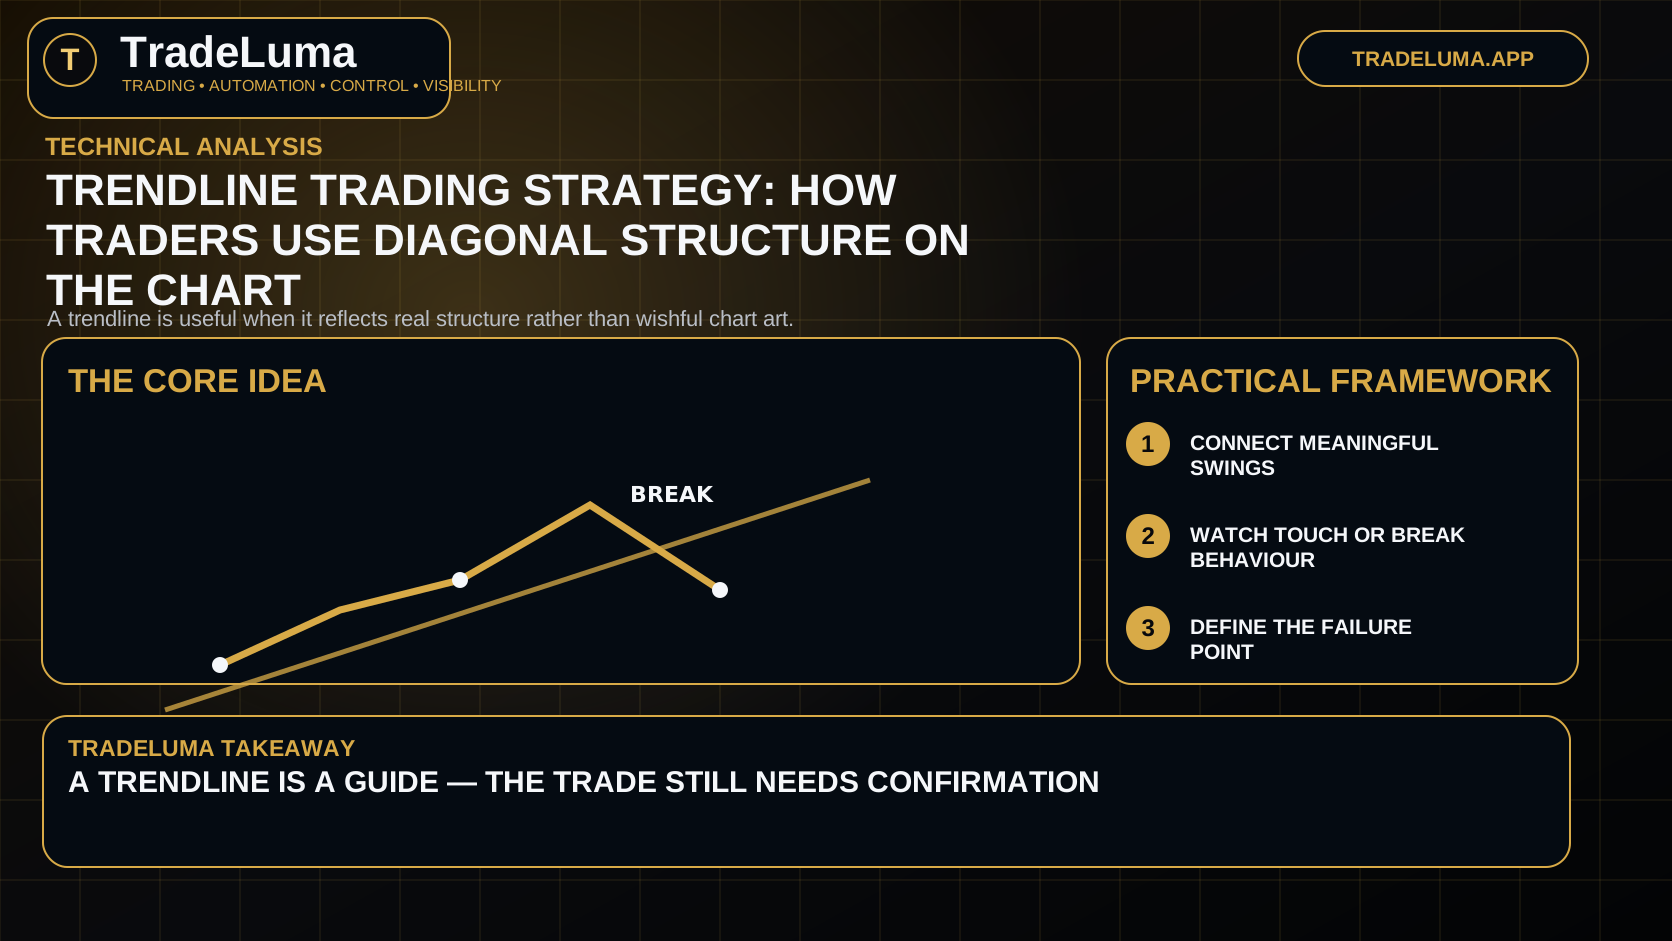
Learn how trendlines are drawn, what they can and cannot do, and how to use them with structure, entries, and invalidation. A trendline is useful when it reflects real structure rather than wishful chart art.
What a trendline does
A trendline connects important swing points to visualise directional structure. In an uptrend it often links higher lows; in a downtrend it often links lower highs.
It can help traders see whether price is respecting a slope, accelerating away from it, or breaking through it.
How to draw a useful trendline
The line should be based on obvious, meaningful swings rather than tiny fluctuations. A cleaner chart generally produces better decisions than a forced line that tries to touch every bar.
Trendlines become more relevant when several reactions or a higher-timeframe structure support the same idea.
Touch setups and break setups
Some traders look for price to reject a rising trendline in an uptrend or a falling trendline in a downtrend as part of a continuation trade.
Others watch for a decisive break as evidence that the previous directional structure may be weakening.
Trendlines need context
A diagonal line alone is rarely enough. The trader still needs to know where horizontal support or resistance sits and what the broader market structure is doing.
A break directly into major support is different from a break that opens into clear space with momentum.
Common mistakes
Forcing lines, redrawing them endlessly, and treating every break as a reversal are common errors. Markets often overshoot a line before choosing direction.
The trendline should organise the trade idea, not remove the need for confirmation, invalidation, and risk control.
Frequently asked questions
How many touches make a valid trendline?+
There is no fixed rule, but more meaningful touches usually make the line more relevant.
Are trendline breaks reliable?+
They can be useful, but false breaks are common, especially in volatile or low-liquidity conditions.
Can trendlines be used on all timeframes?+
Yes, though lower timeframes often produce more noise and may need stricter filtering.
Technical analysis
Continue with the topic hub.
Browse the related TradeLuma guides and build the topic from foundations through practical application.
Explore Technical analysis guides →Continue learning
Related guides.

Breakout and retest trading: how traders use confirmation after a level breaks
Learn what a breakout and retest setup is, why many traders prefer it, and how to avoid confusing every pullback with confirmation.
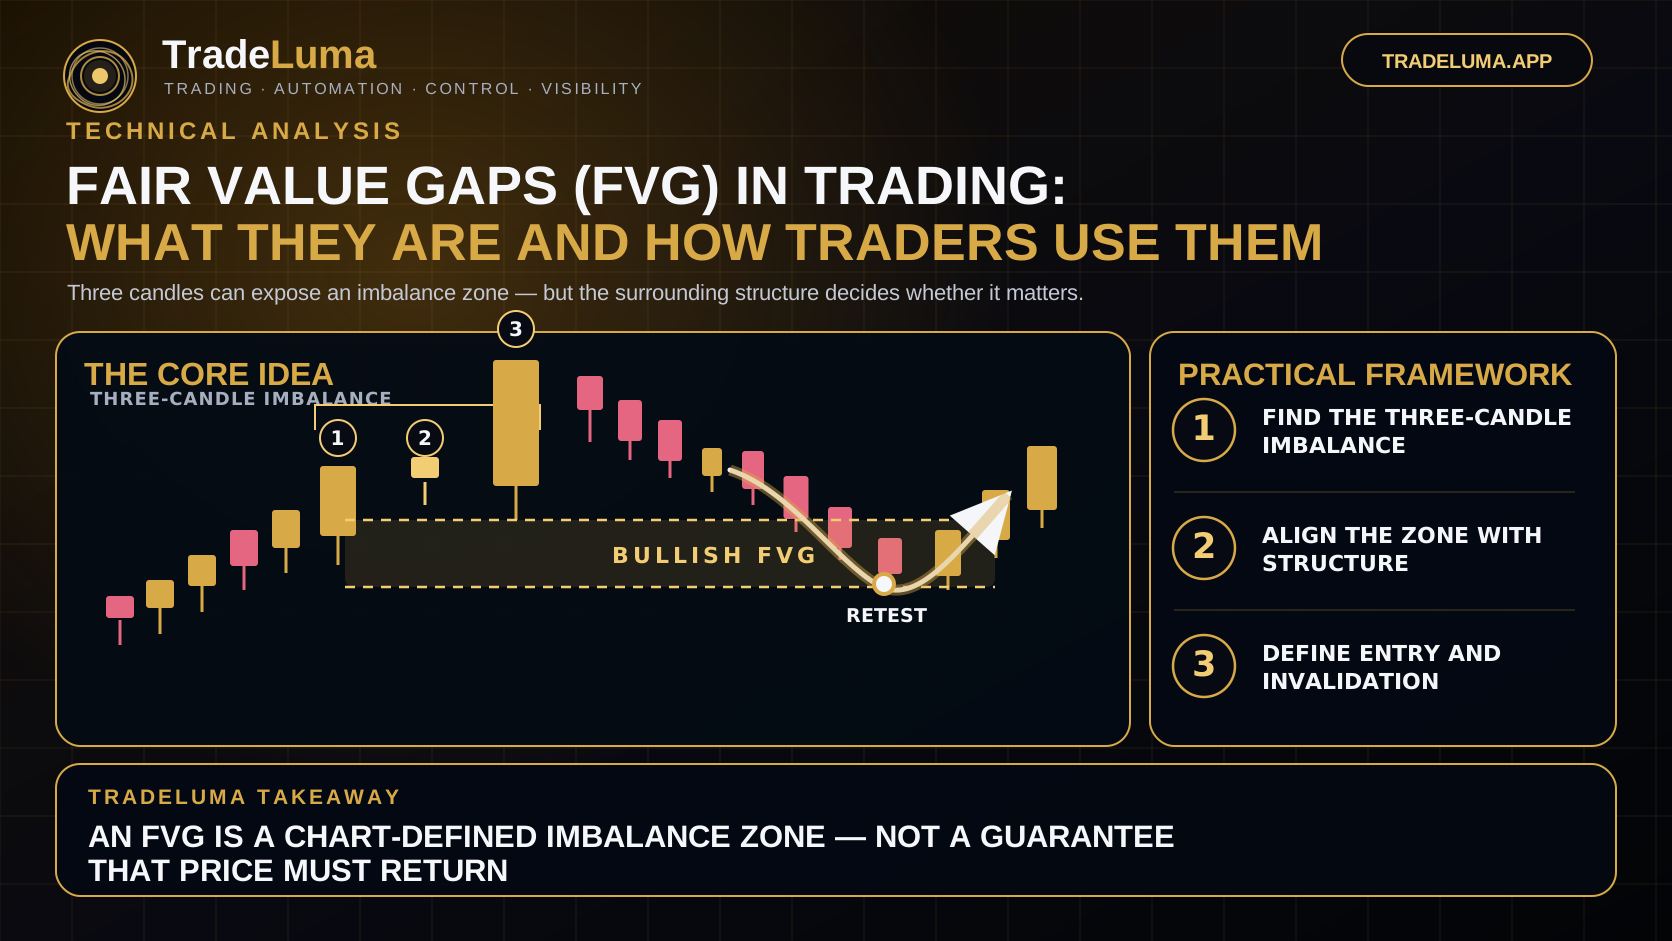
Fair Value Gaps (FVG) in Trading: What They Are and How Traders Use Them
Learn what fair value gaps are, how traders identify bullish and bearish FVGs, and how imbalance zones are combined with structure and risk.
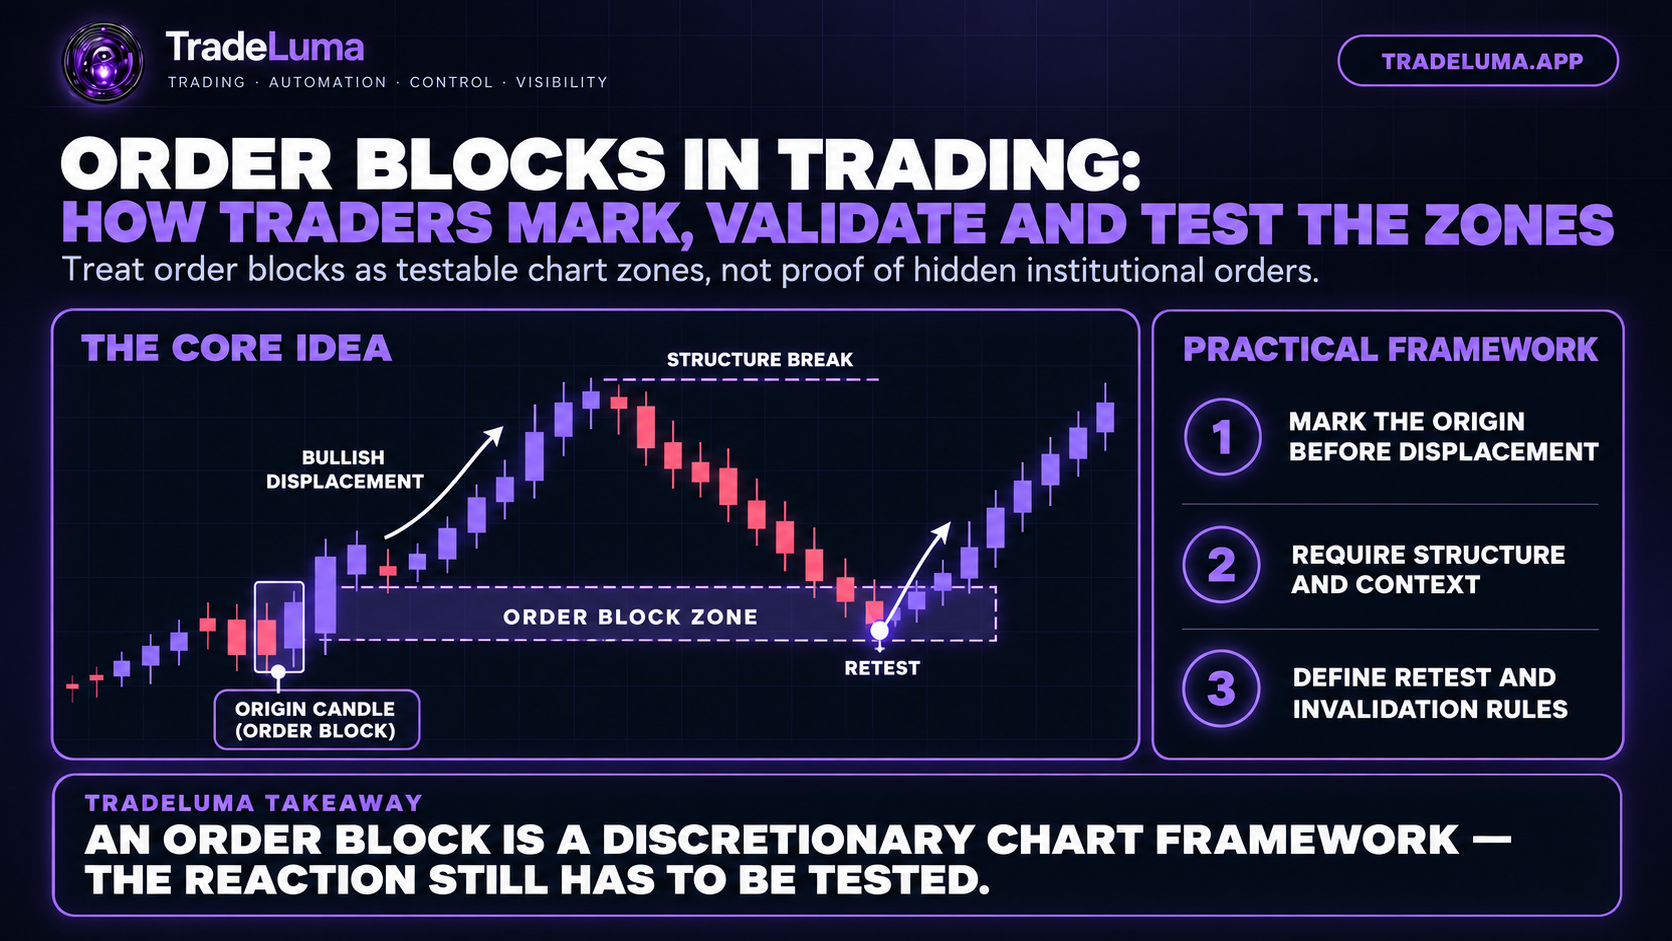
Order Blocks in Trading: How Traders Mark, Validate and Test the Zones
Learn what order blocks mean in technical analysis, how bullish and bearish zones are marked, and how traders test displacement, retests, and invalidation.