
Indicators
Moving average crossover strategy: how trend traders use signal changes
Learn how moving average crossover strategies work, what the signals mean, and how traders reduce whipsaws with structure and context.
On this page+
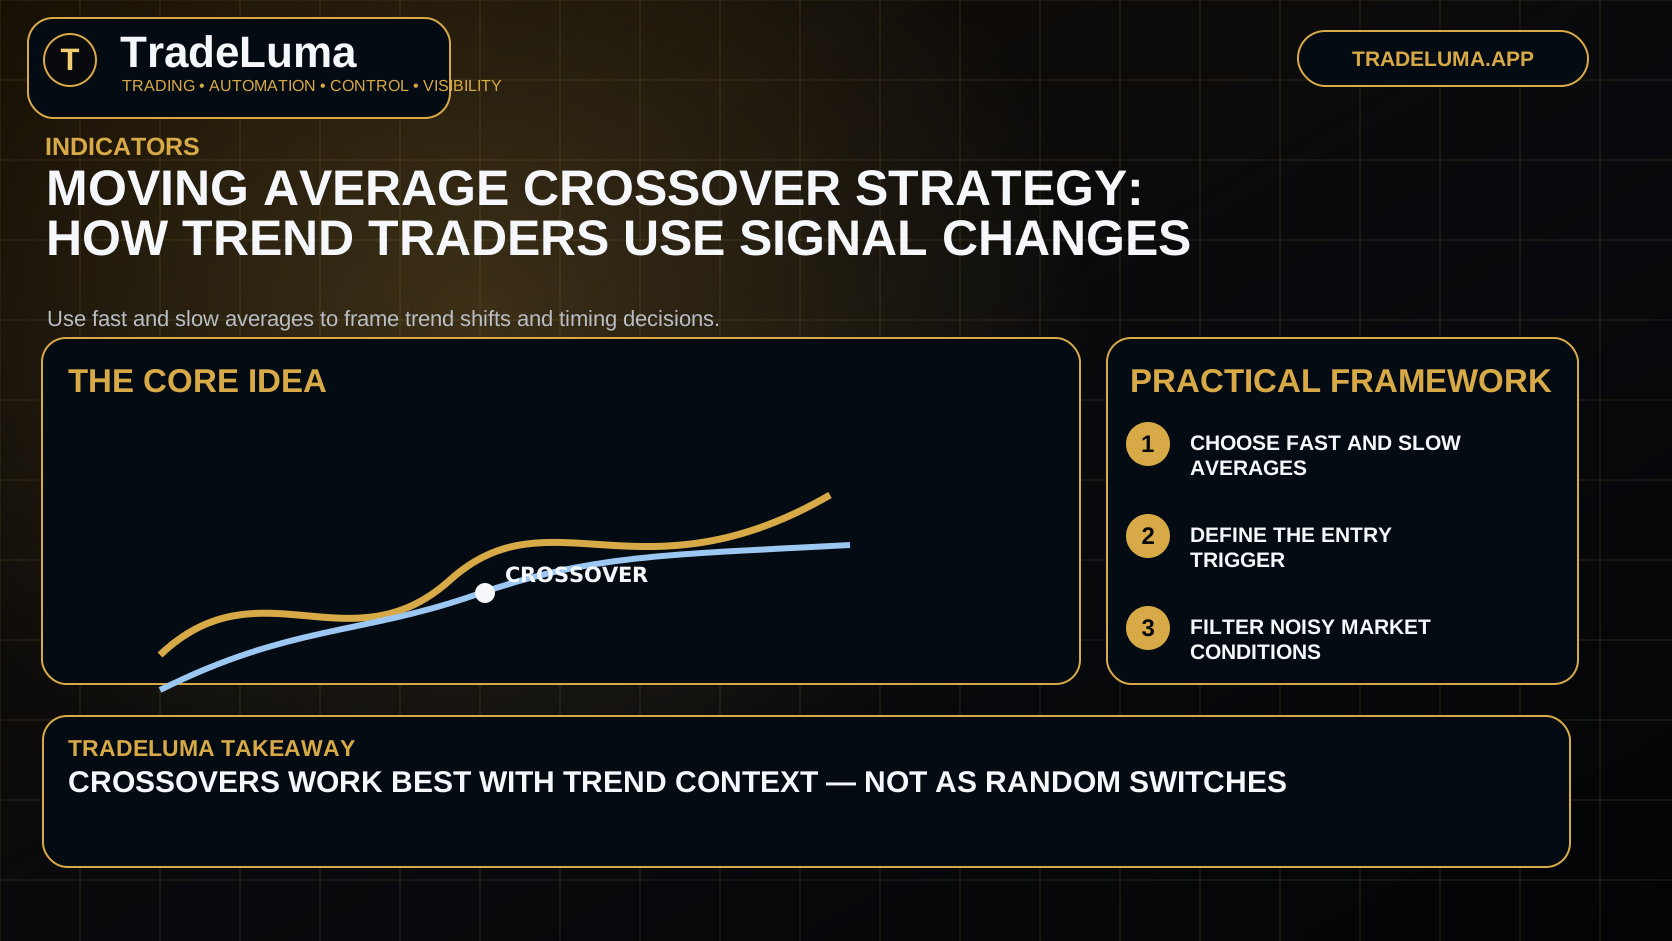
Learn how moving average crossover strategies work, what the signals mean, and how traders reduce whipsaws with structure and context. Use fast and slow averages to frame trend shifts and timing decisions.
How a crossover strategy works
A crossover occurs when a faster moving average crosses above or below a slower moving average. Traders often interpret the event as a possible change in momentum or trend direction.
Common combinations include 9 and 21 EMAs or 20 and 50 moving averages, but the useful pair depends on the market and timeframe.
Why traders use crossovers
The method is simple, objective, and easy to test. It gives a rule-based signal for changing bias instead of encouraging constant guessing.
Because moving averages smooth price, they can also help traders stay aligned with broader direction rather than reacting to every small fluctuation.
The main weakness: whipsaws
Crossover systems often struggle in sideways markets where price repeatedly chops around the averages and produces false shifts.
That is why traders often combine the signal with market structure, higher-timeframe direction, volatility, or trend-strength filters.
Entries, exits, and confirmation
Some traders enter at the crossover itself, while others wait for a candle close beyond the averages or for a pullback after the signal.
Exits may use an opposite crossover, a structural break, a trailing stop, or predefined profit rules depending on the strategy objective.
How to test a crossover strategy
The important questions are not only which averages to use, but also in which market, timeframe, and session the logic remains robust.
Testing should include realistic costs and different market regimes so the trader can see whether the strategy captures persistent trends or merely fits historical noise.
Frequently asked questions
Which moving averages are best for a crossover strategy?+
There is no single best pair. Traders choose combinations that fit their timeframe, instrument, and tolerance for lag versus sensitivity.
Are EMA crossovers better than SMA crossovers?+
EMAs react faster to recent price changes, while SMAs are smoother. The better choice depends on the strategy goal and testing results.
Do moving average crossovers work in range markets?+
They often perform worse in choppy ranges because repeated crossings can create whipsaw trades.
Trading indicators
Continue with the topic hub.
Browse the related TradeLuma guides and build the topic from foundations through practical application.
Explore Trading indicators guides →Continue learning
Related guides.
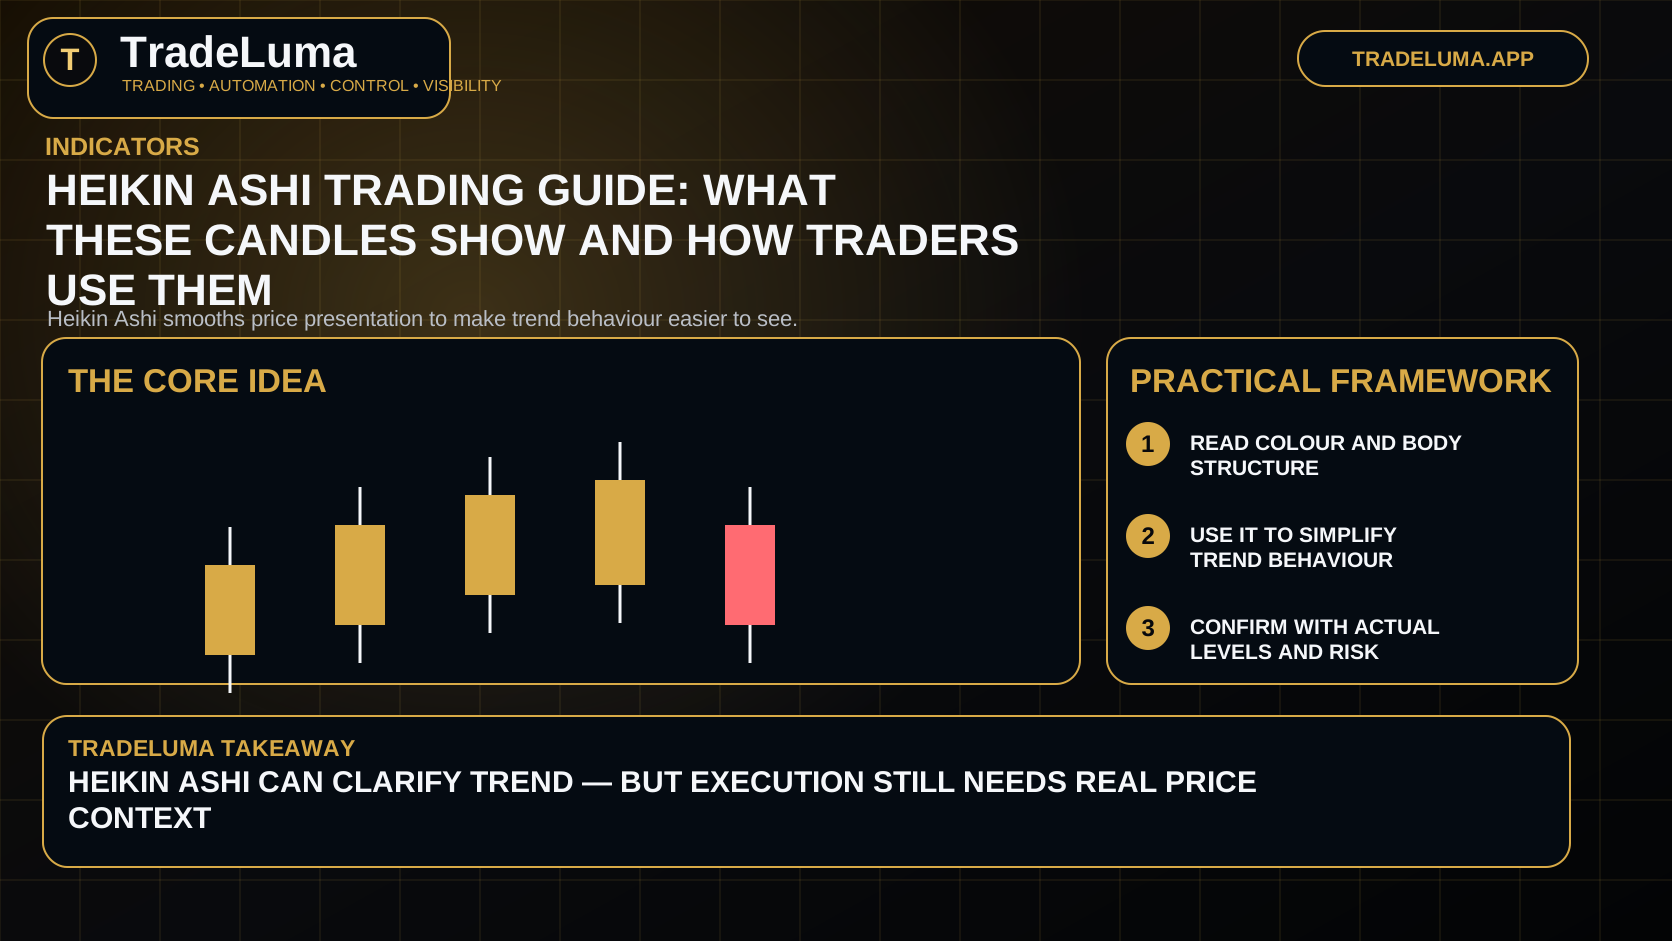
Heikin Ashi trading guide: what these candles show and how traders use them
A practical guide to Heikin Ashi candles, how they differ from standard candlesticks, and when traders use them to simplify trend reading.
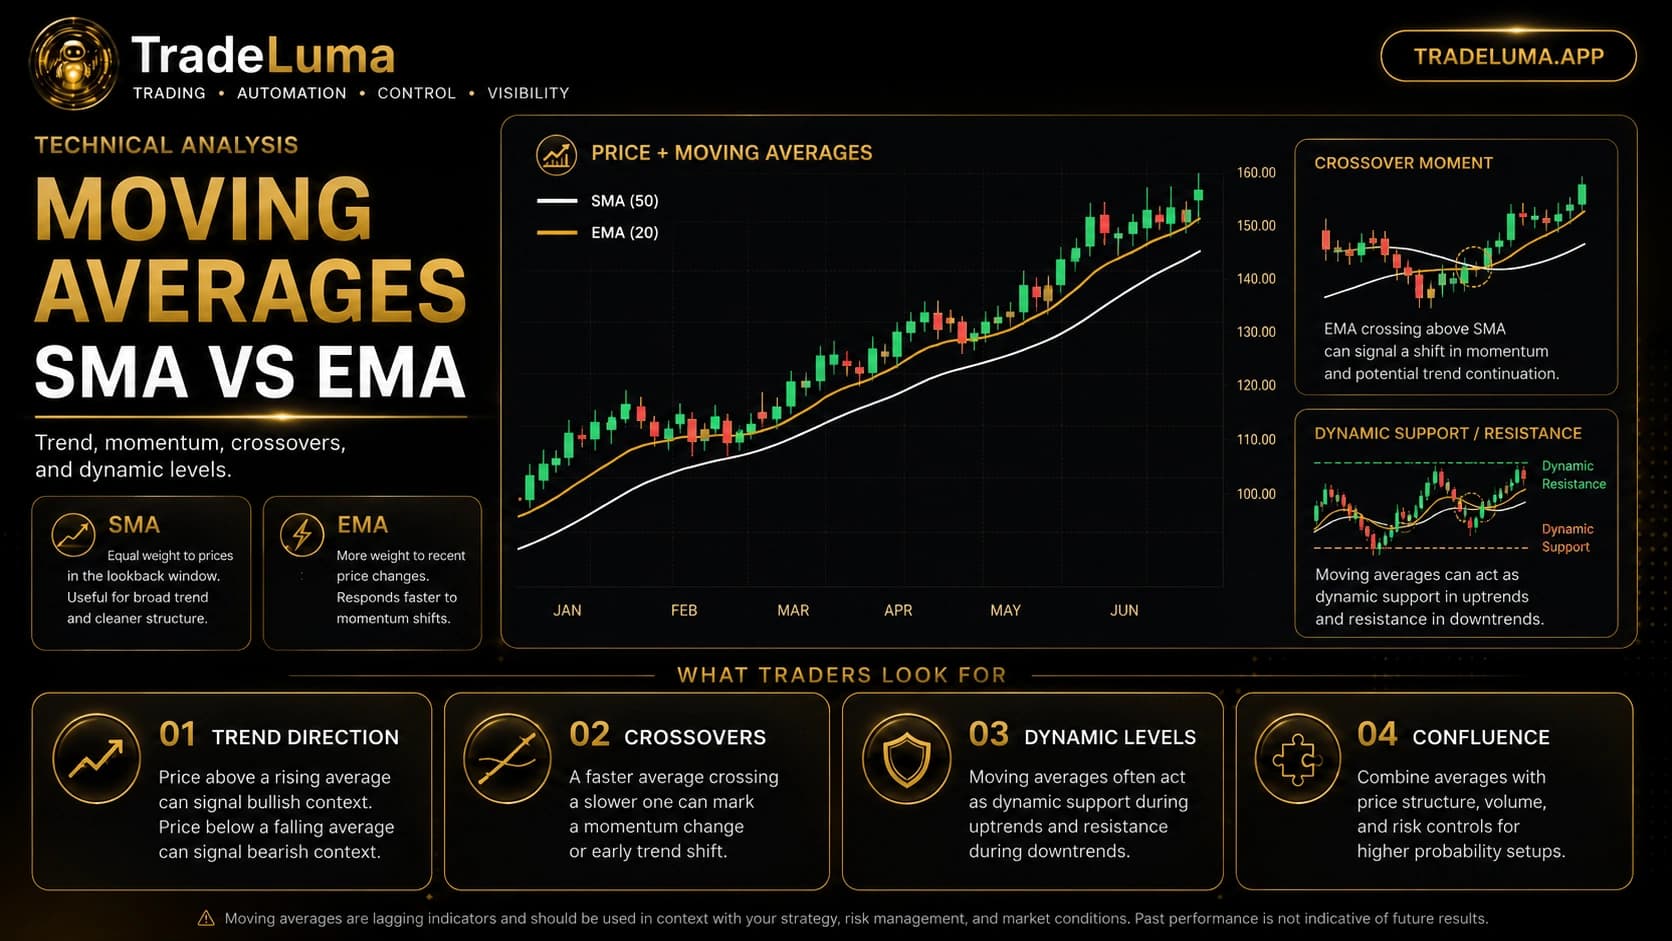
Moving averages explained: SMA vs EMA in trading
Learn how simple and exponential moving averages work, the difference between SMA and EMA, and how traders use trend, crossovers, and dynamic levels.
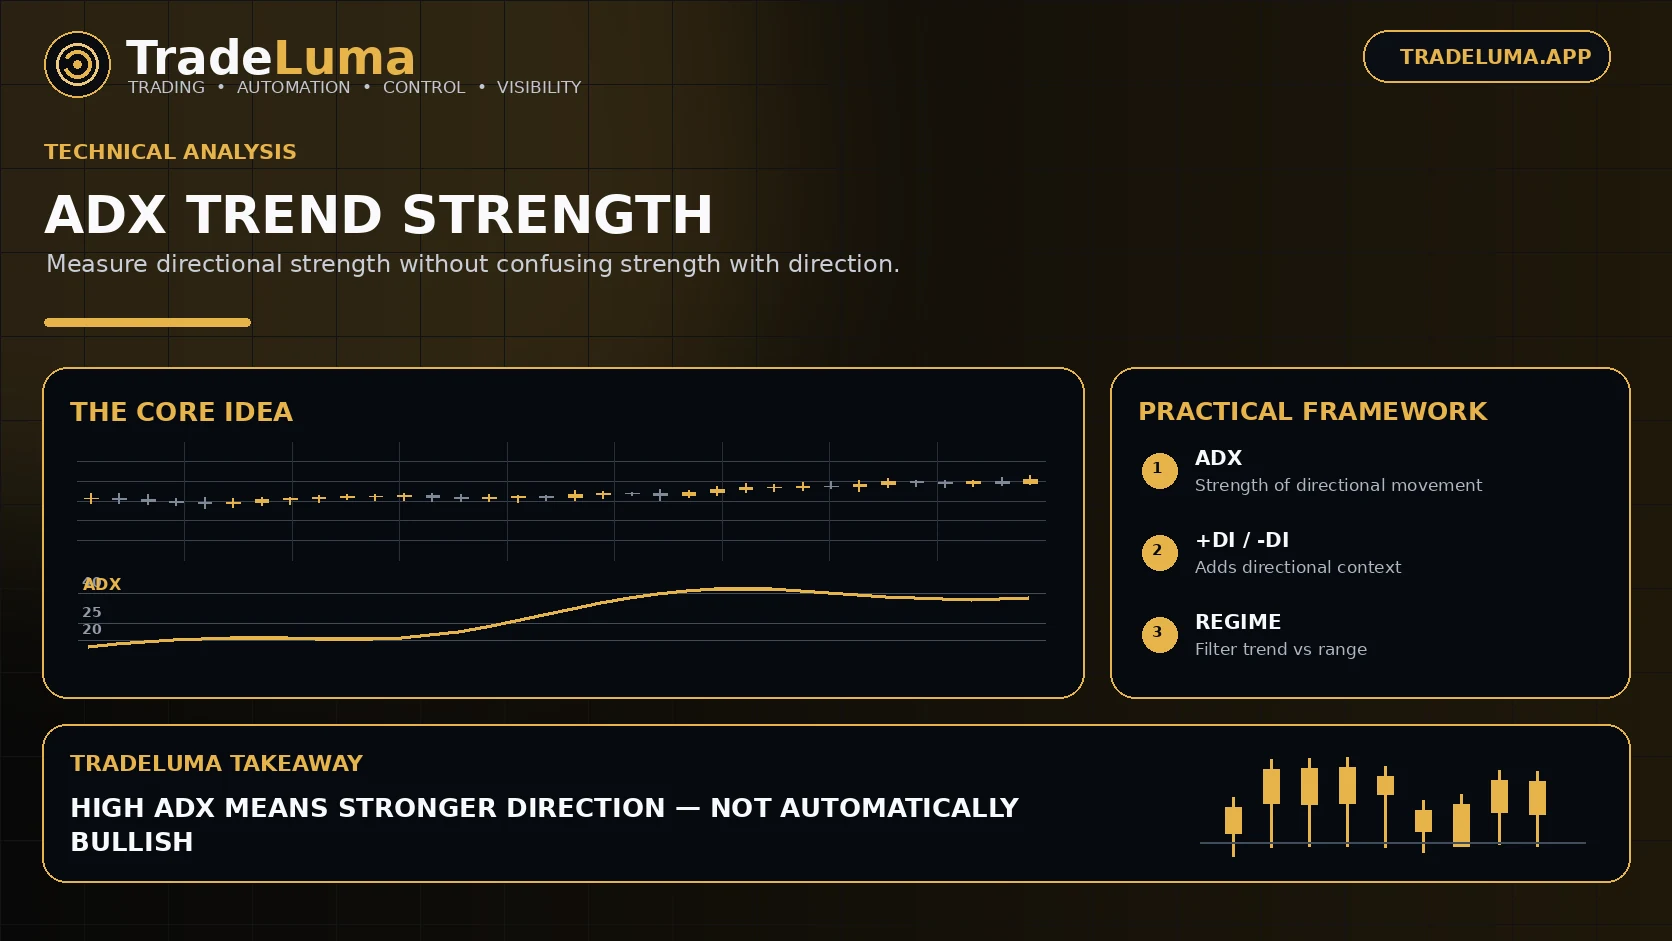
ADX Indicator Explained: How to Measure Trend Strength
Learn how the Average Directional Index (ADX) measures trend strength, how +DI and -DI add directional context, and how traders use ADX as a filter.