
Indicators·
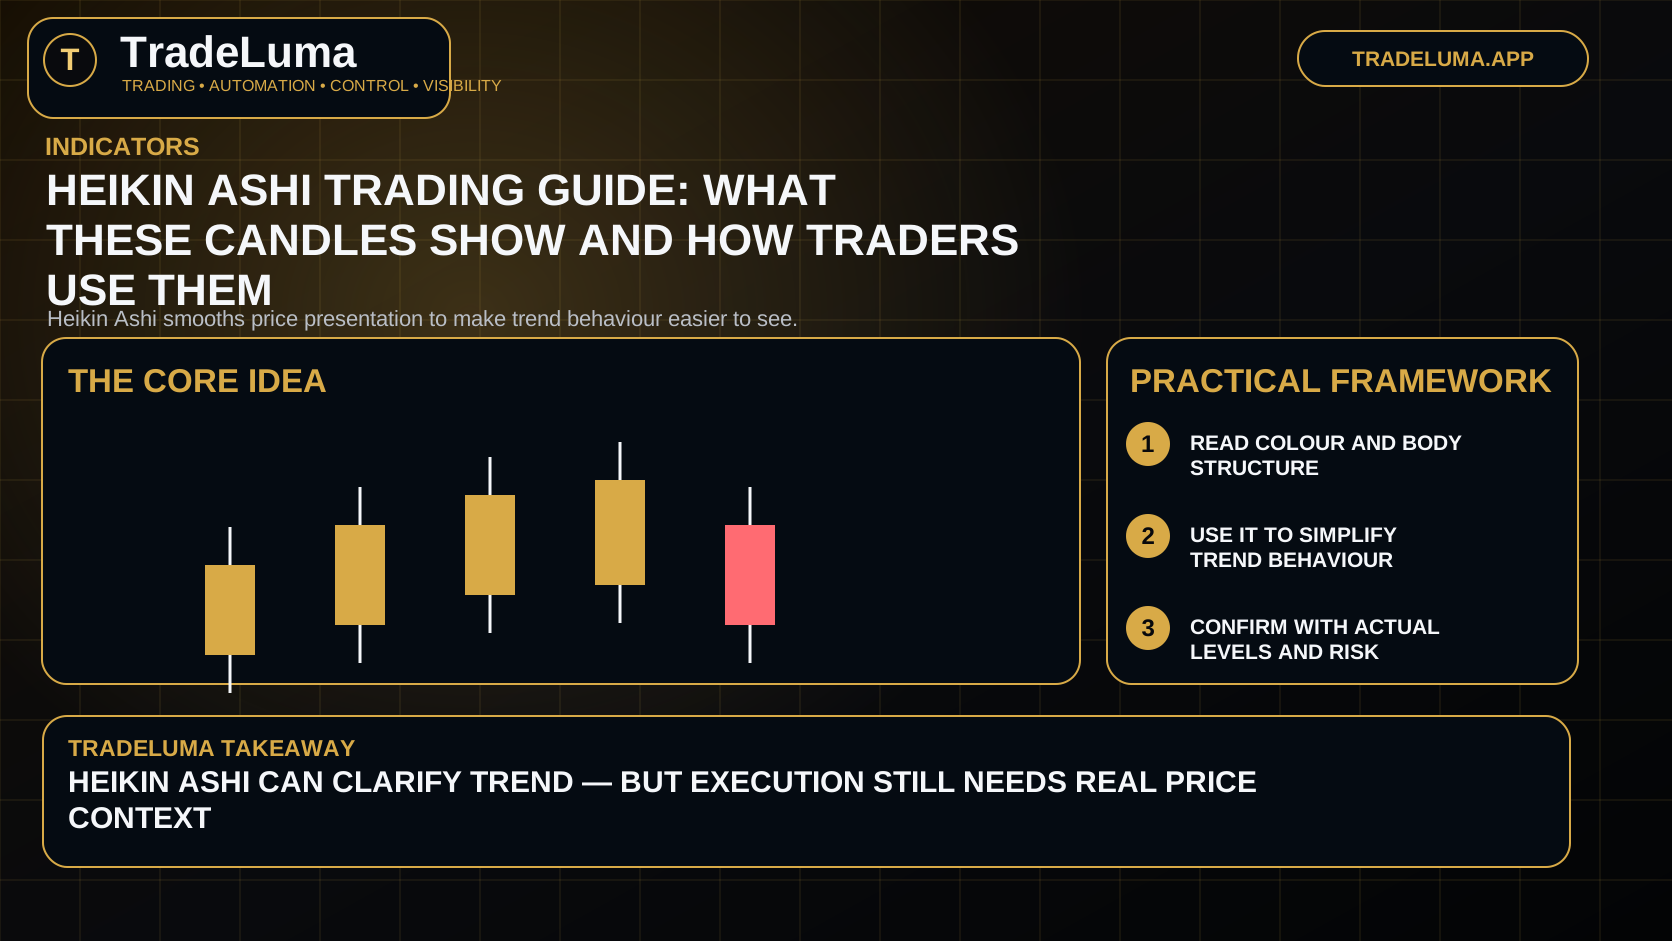
Heikin Ashi trading guide: what these candles show and how traders use them
A practical guide to Heikin Ashi candles, how they differ from standard candlesticks, and when traders use them to simplify trend reading.
Trading indicators
Practical guides to RSI, MACD, moving averages, ATR, ADX, Bollinger Bands, stochastic, Ichimoku, volume profile, and other trading indicators.
Indicators transform price, volume, or volatility into a different view of market behaviour. They can help organise a process, but they do not remove uncertainty or replace risk management.
Different indicators answer different questions. Trend tools, momentum oscillators, and volatility measures should be chosen because they support a defined decision, not because more indicators make a chart look more complete.
Learn what each indicator measures, understand where it tends to lag or create noise, then test it in the exact market and timeframe where you intend to use it.
Start here
A practical guide to Heikin Ashi candles, how they differ from standard candlesticks, and when traders use them to simplify trend reading.
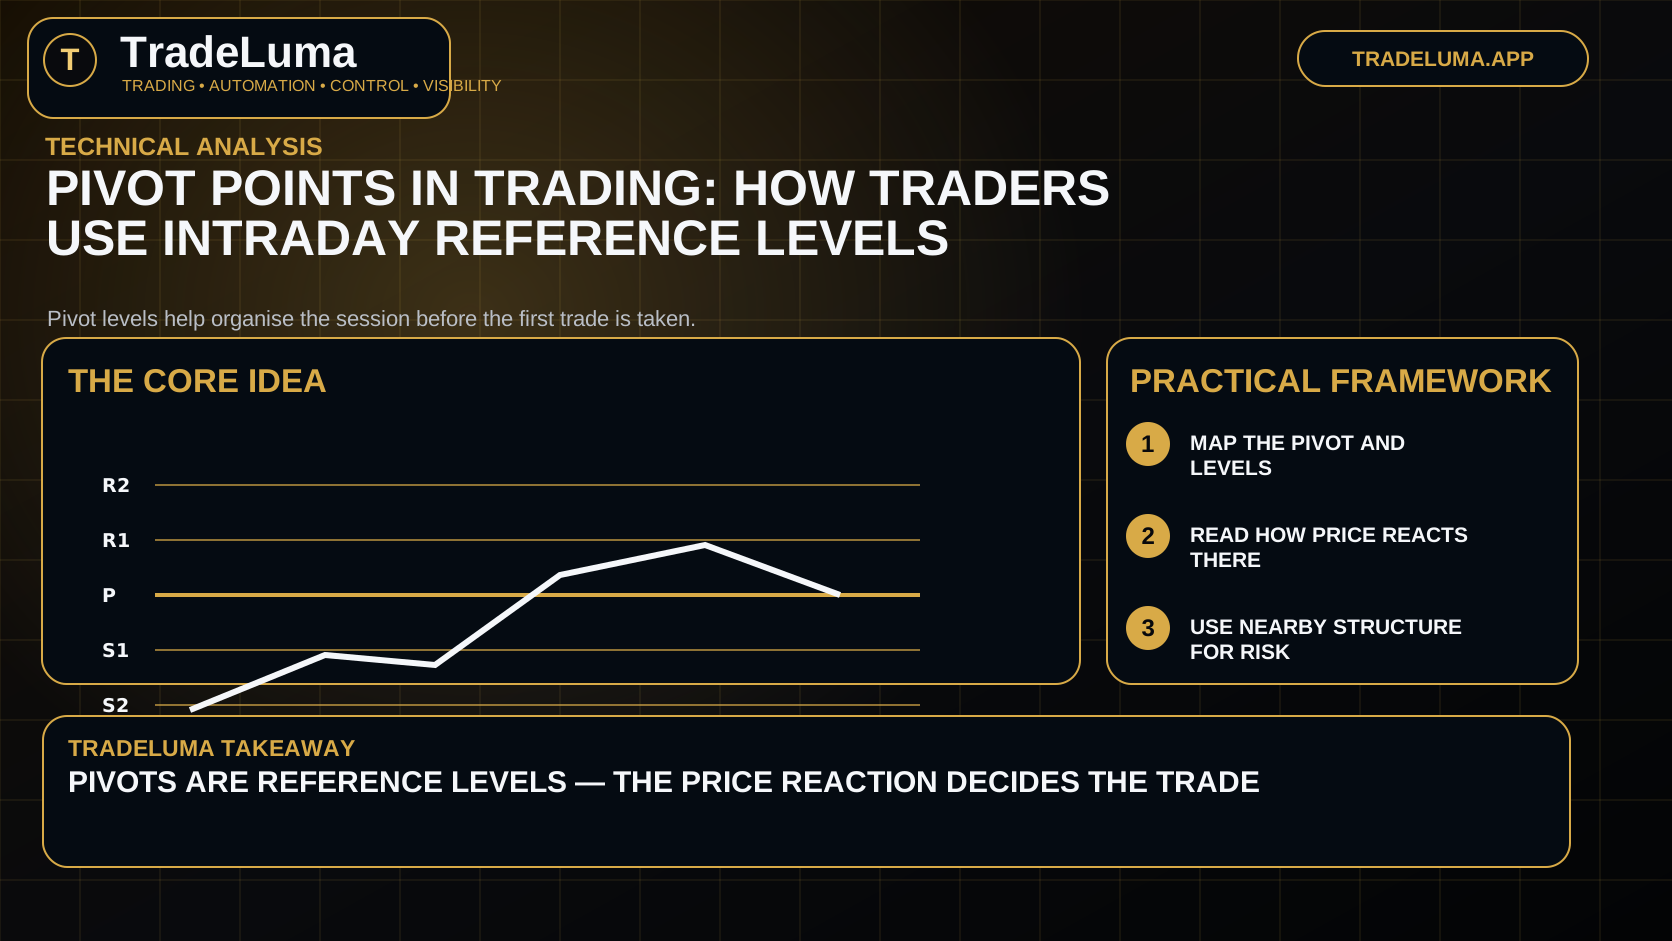
Learn what pivot points are, how they are calculated, and how day traders use them as reference levels for bias, reactions, and trade planning.
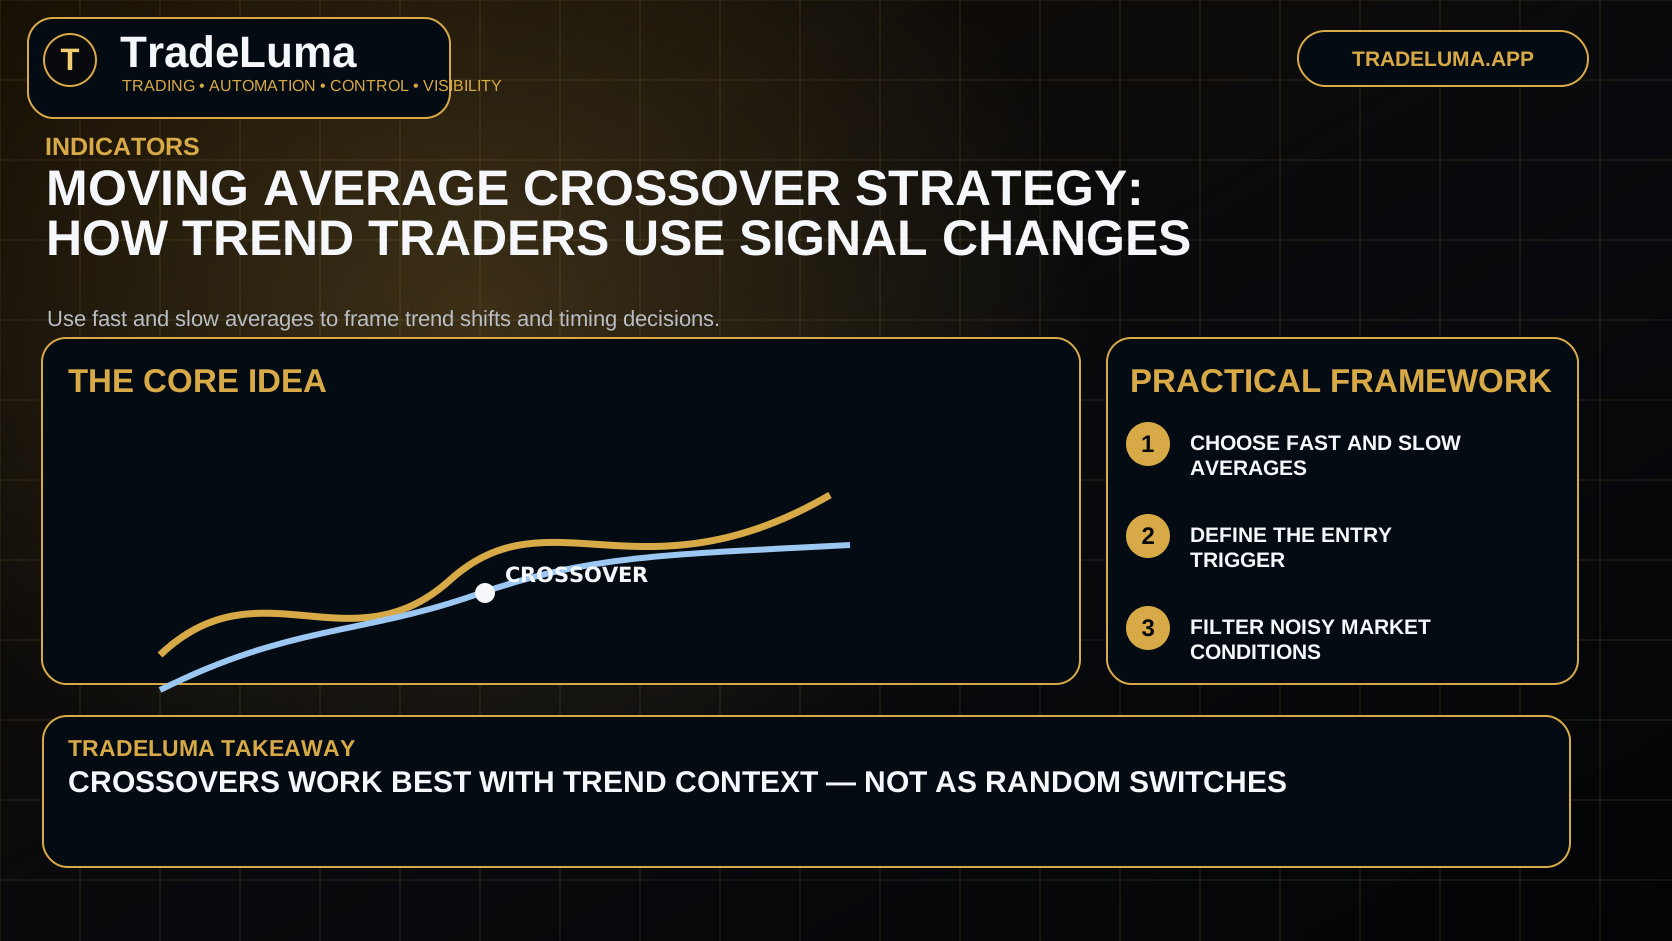
Learn how moving average crossover strategies work, what the signals mean, and how traders reduce whipsaws with structure and context.
Full library
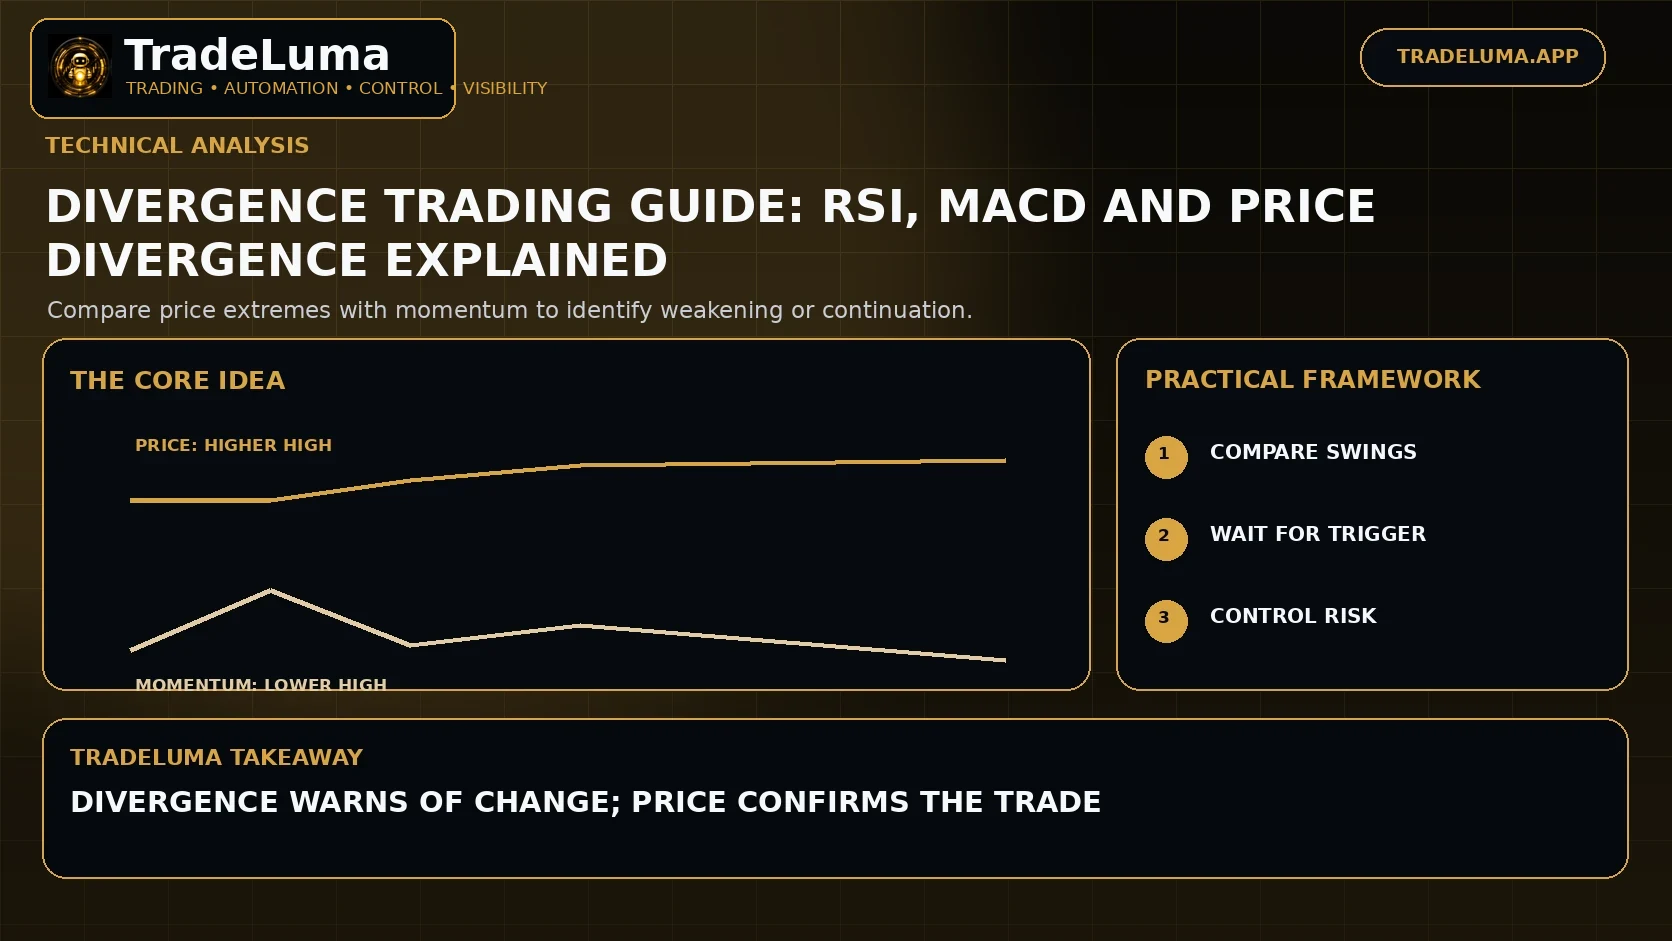
Learn bullish and bearish divergence, hidden divergence, why momentum can diverge from price, and how to use confirmation instead of predicting reversals too early.
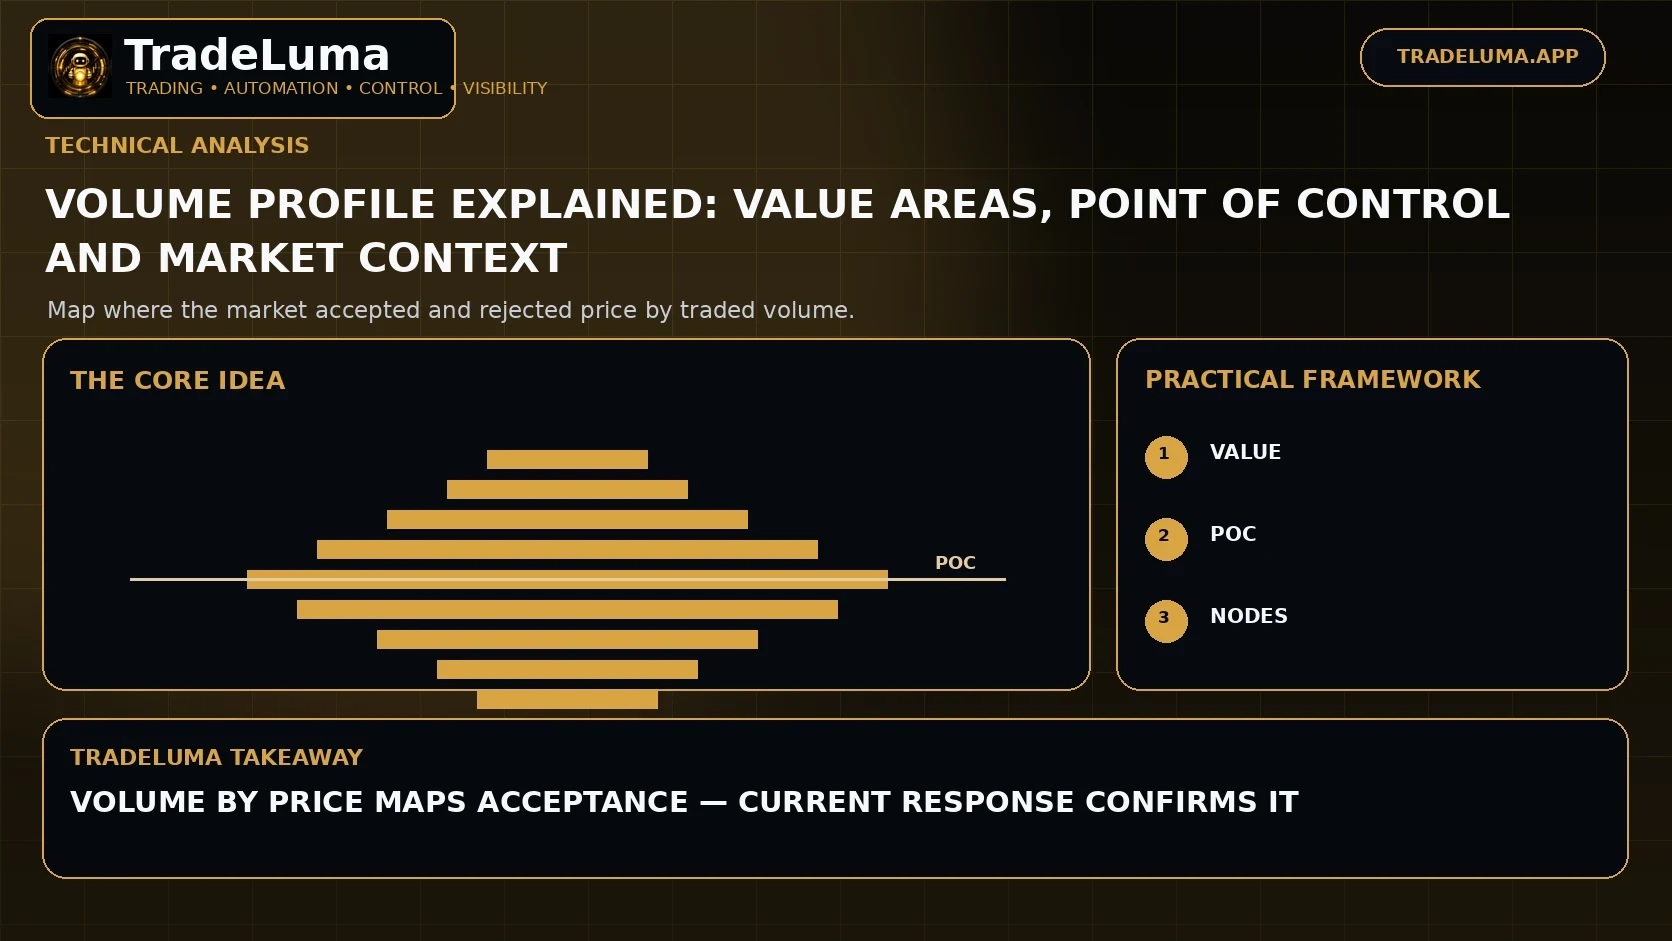
Learn how volume profile distributes traded volume by price, what the point of control and value area mean, and how traders use high- and low-volume nodes.
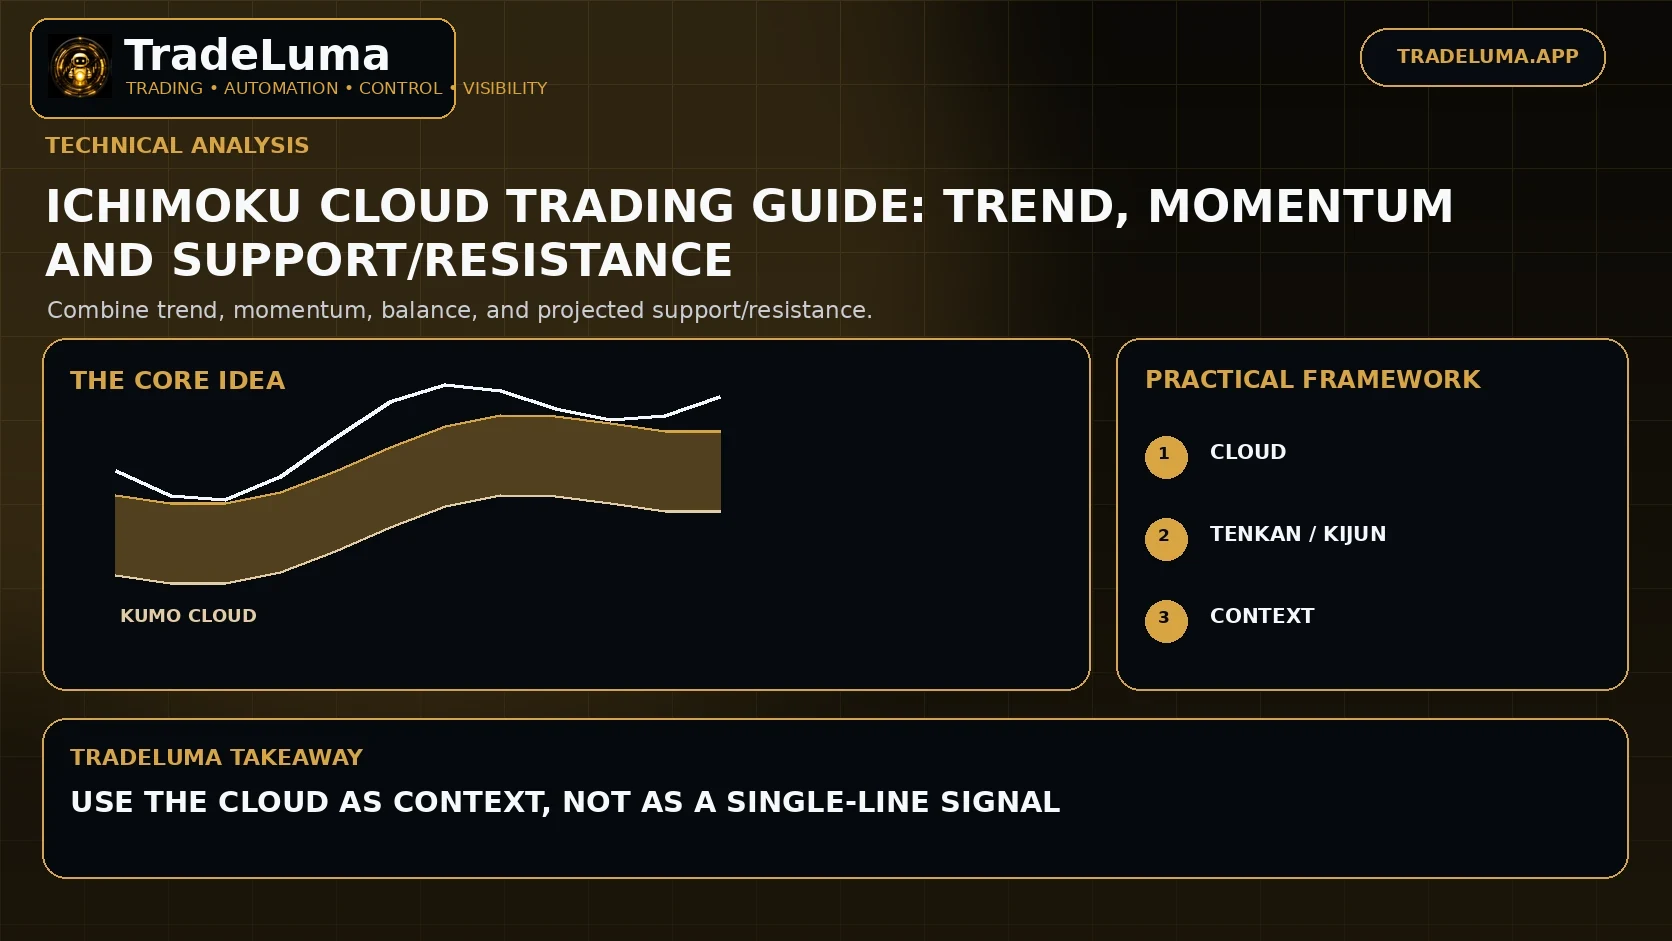
Learn the Ichimoku Cloud components, how traders read trend and momentum, and how Tenkan, Kijun, Senkou spans, and Chikou interact.
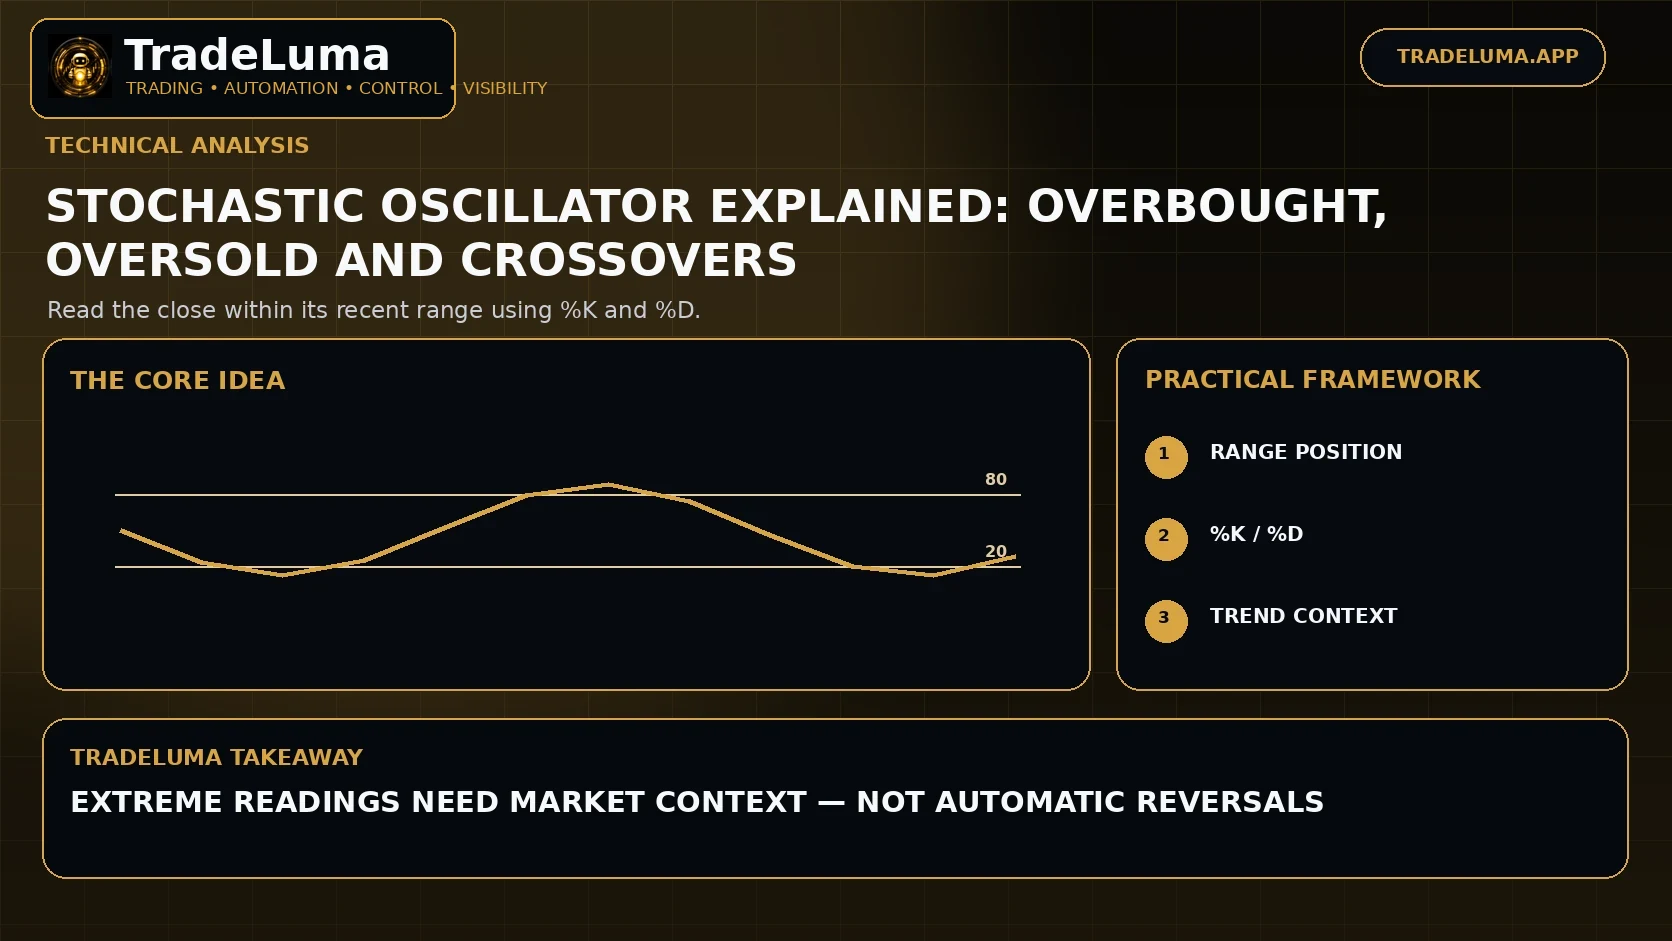
Learn how the stochastic oscillator compares the close with the recent trading range, how %K and %D work, and how traders use it in trends and ranges.
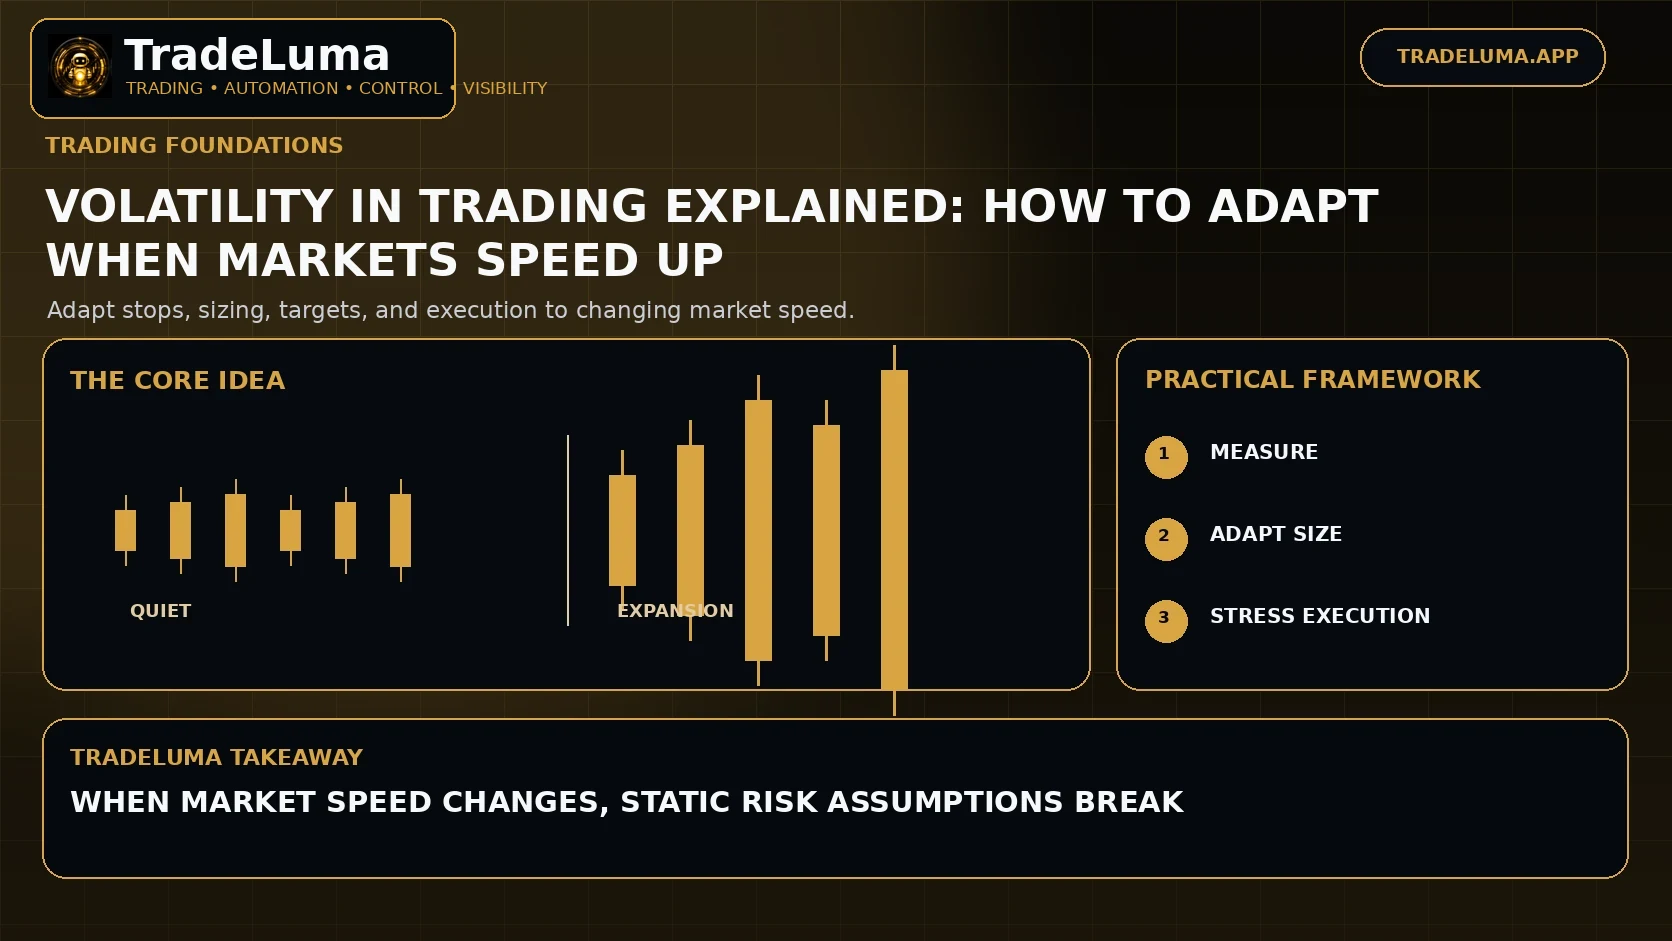
Learn what trading volatility means, how ATR and realised range measure it, and how volatility affects stops, position size, targets, and execution.
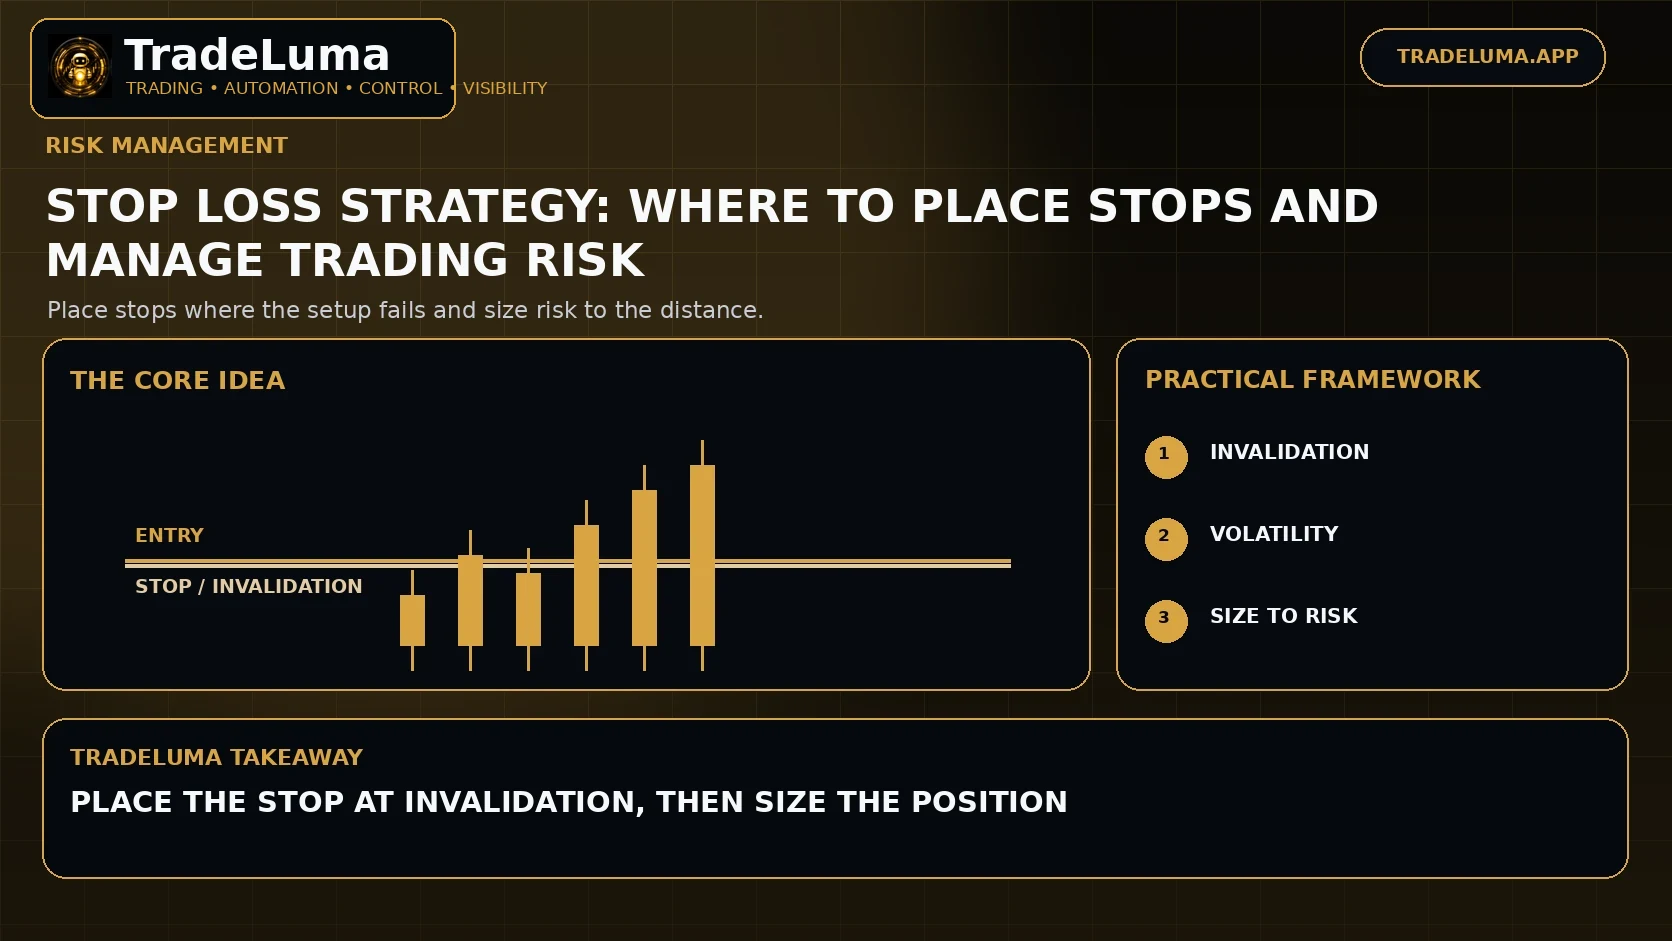
Learn how stop losses work, where traders place them, how volatility affects stop distance, and why position size should adapt to the invalidation point.
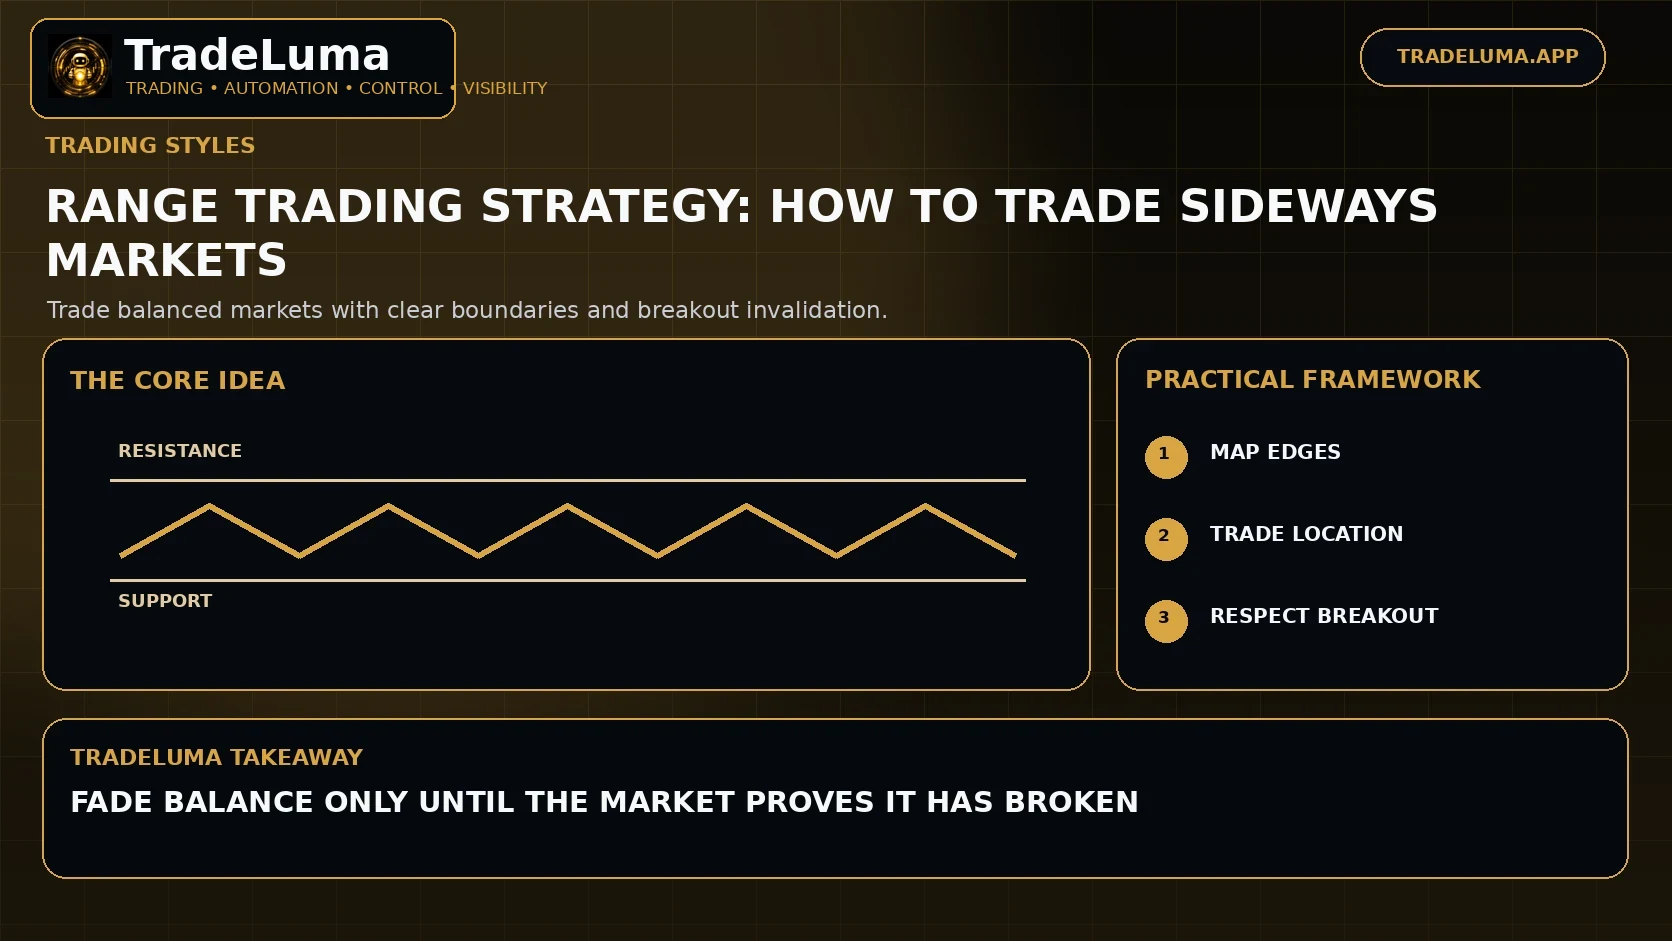
Learn how range trading identifies support, resistance, failed breakouts, and mean reversion when markets move sideways instead of trending.
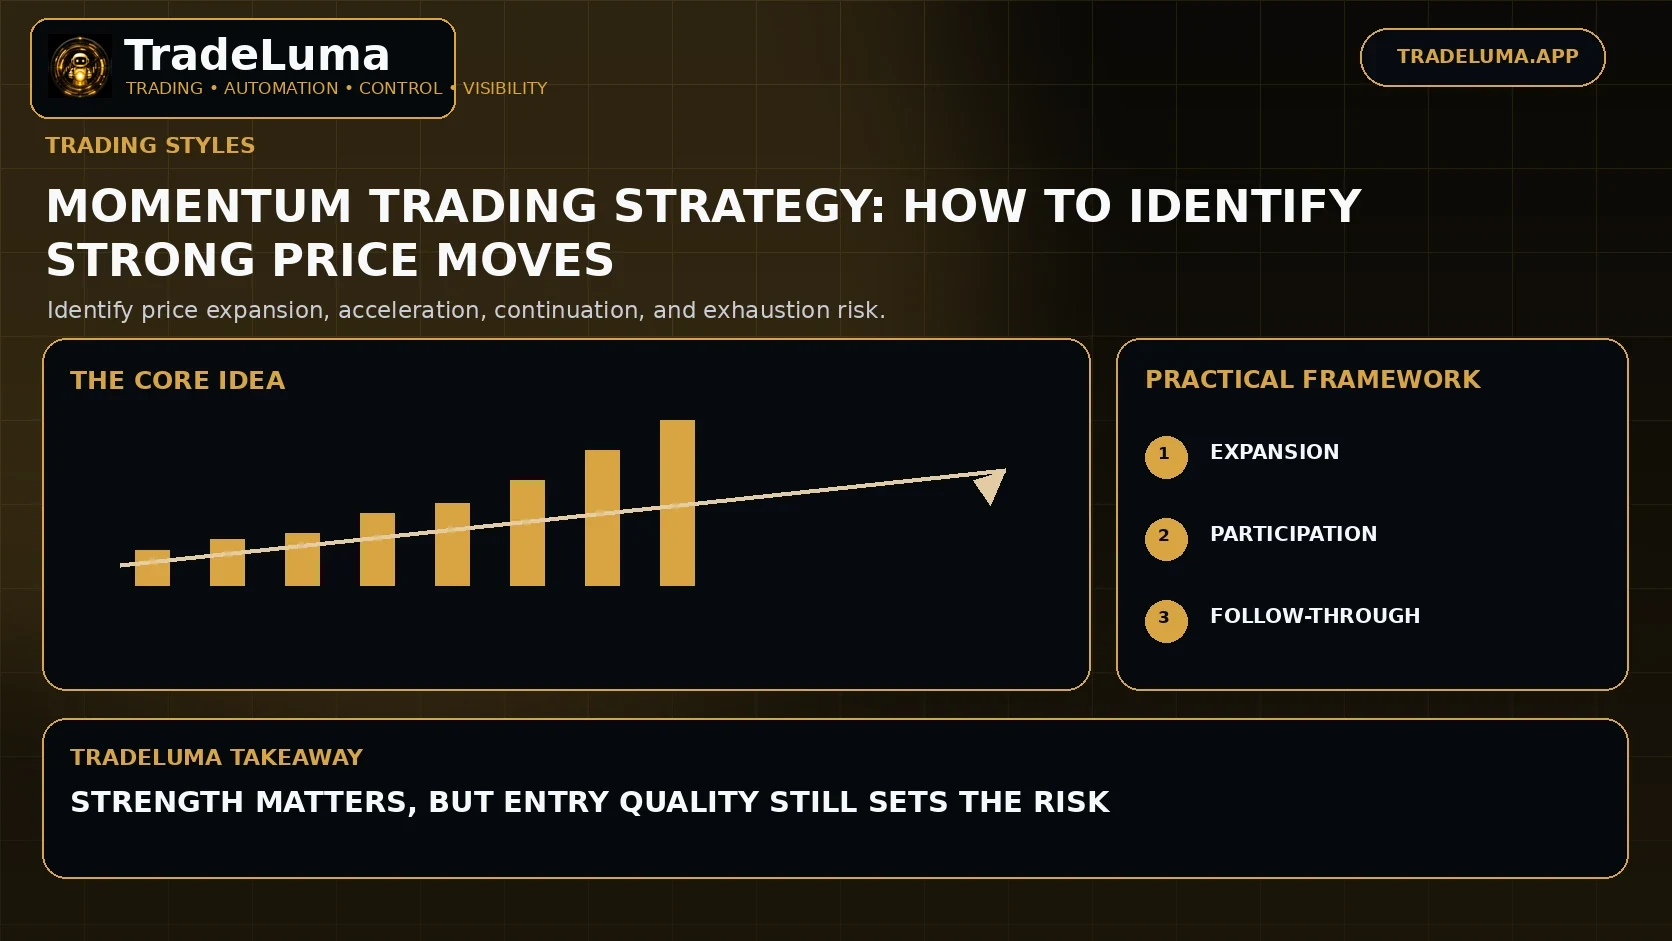
Learn how momentum trading works, how traders identify acceleration and continuation, and how to manage the risk of entering fast-moving markets.
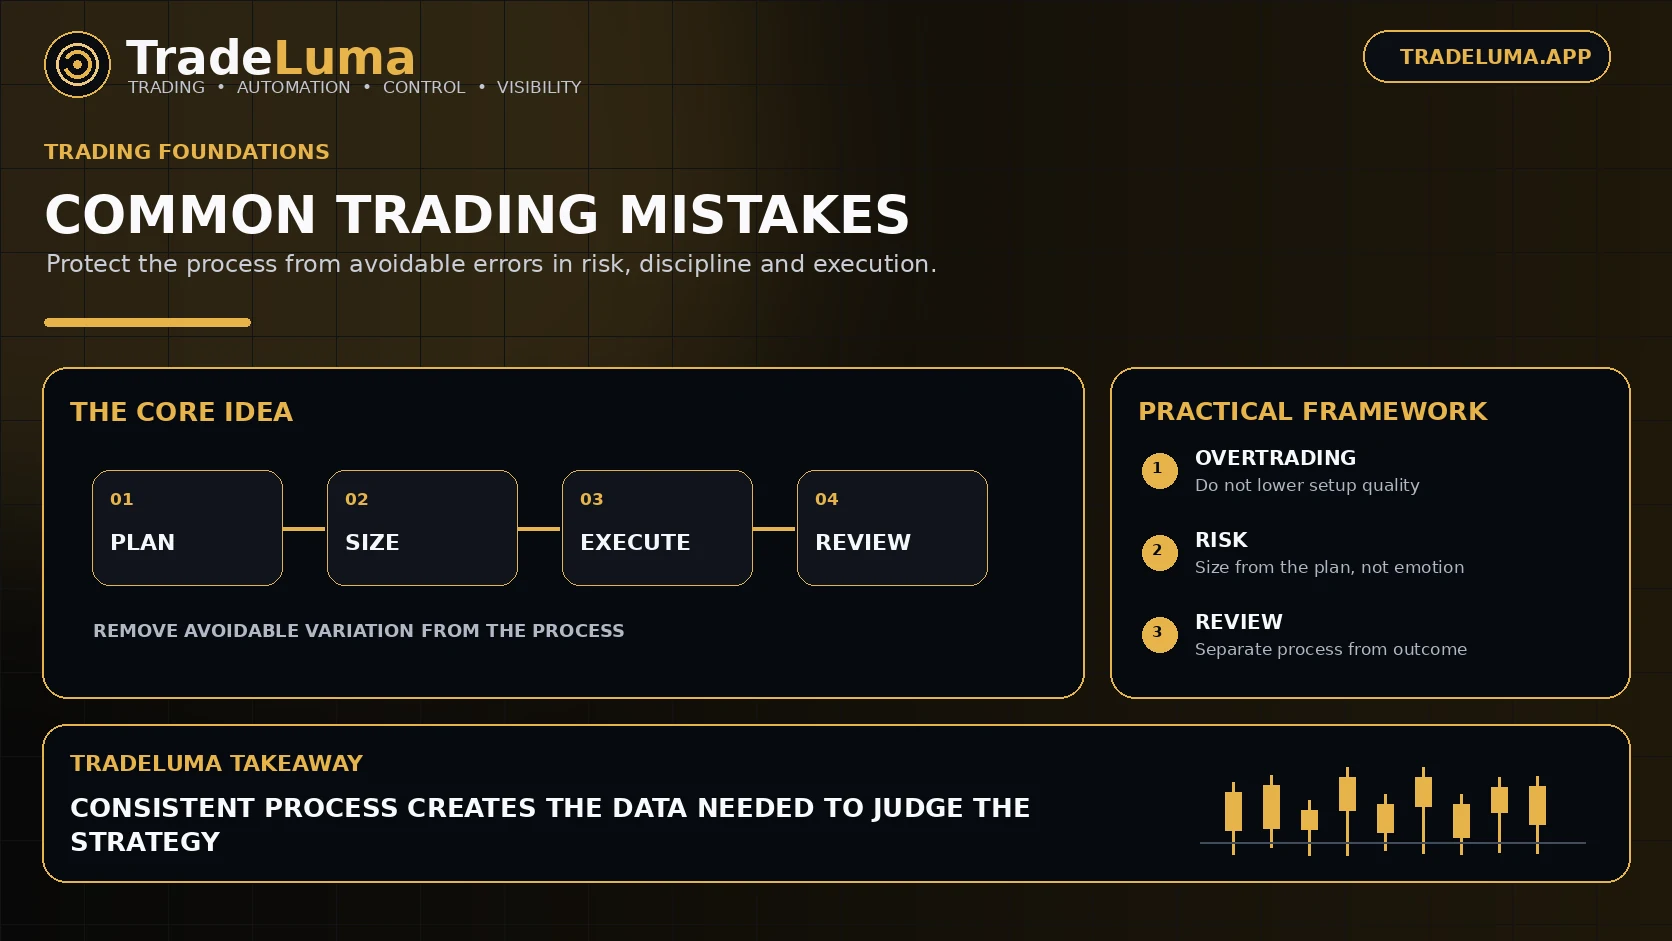
Review common trading mistakes including overtrading, revenge trading, oversized positions, moving stops, strategy hopping, poor testing, and ignoring costs.
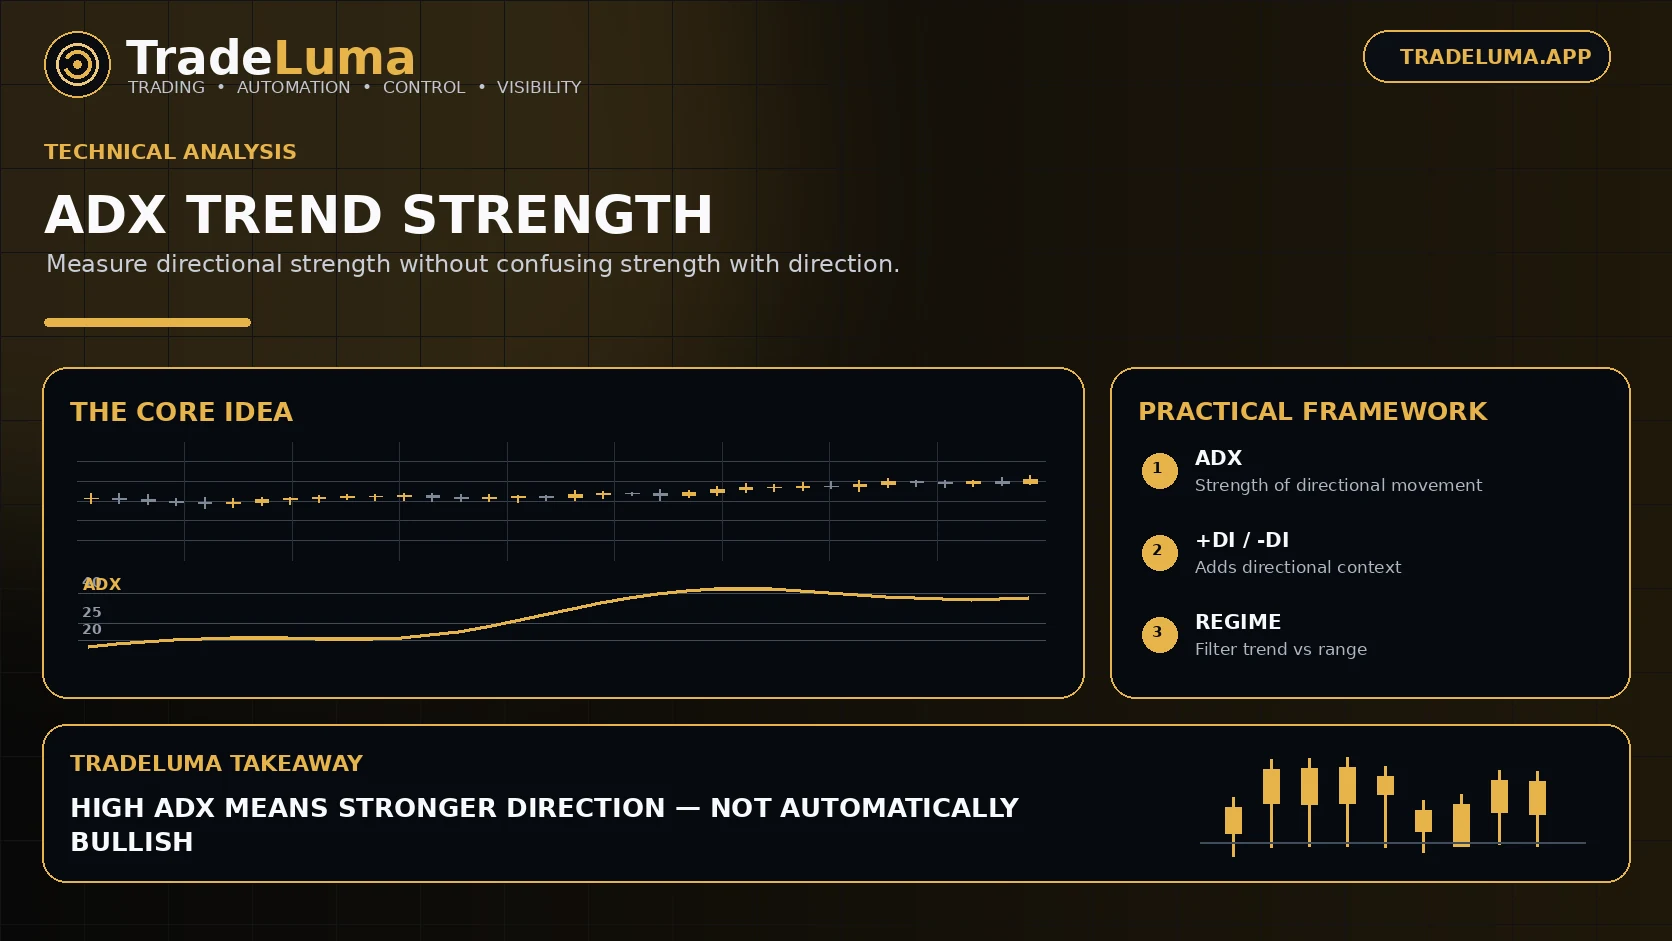
Learn how the Average Directional Index (ADX) measures trend strength, how +DI and -DI add directional context, and how traders use ADX as a filter.
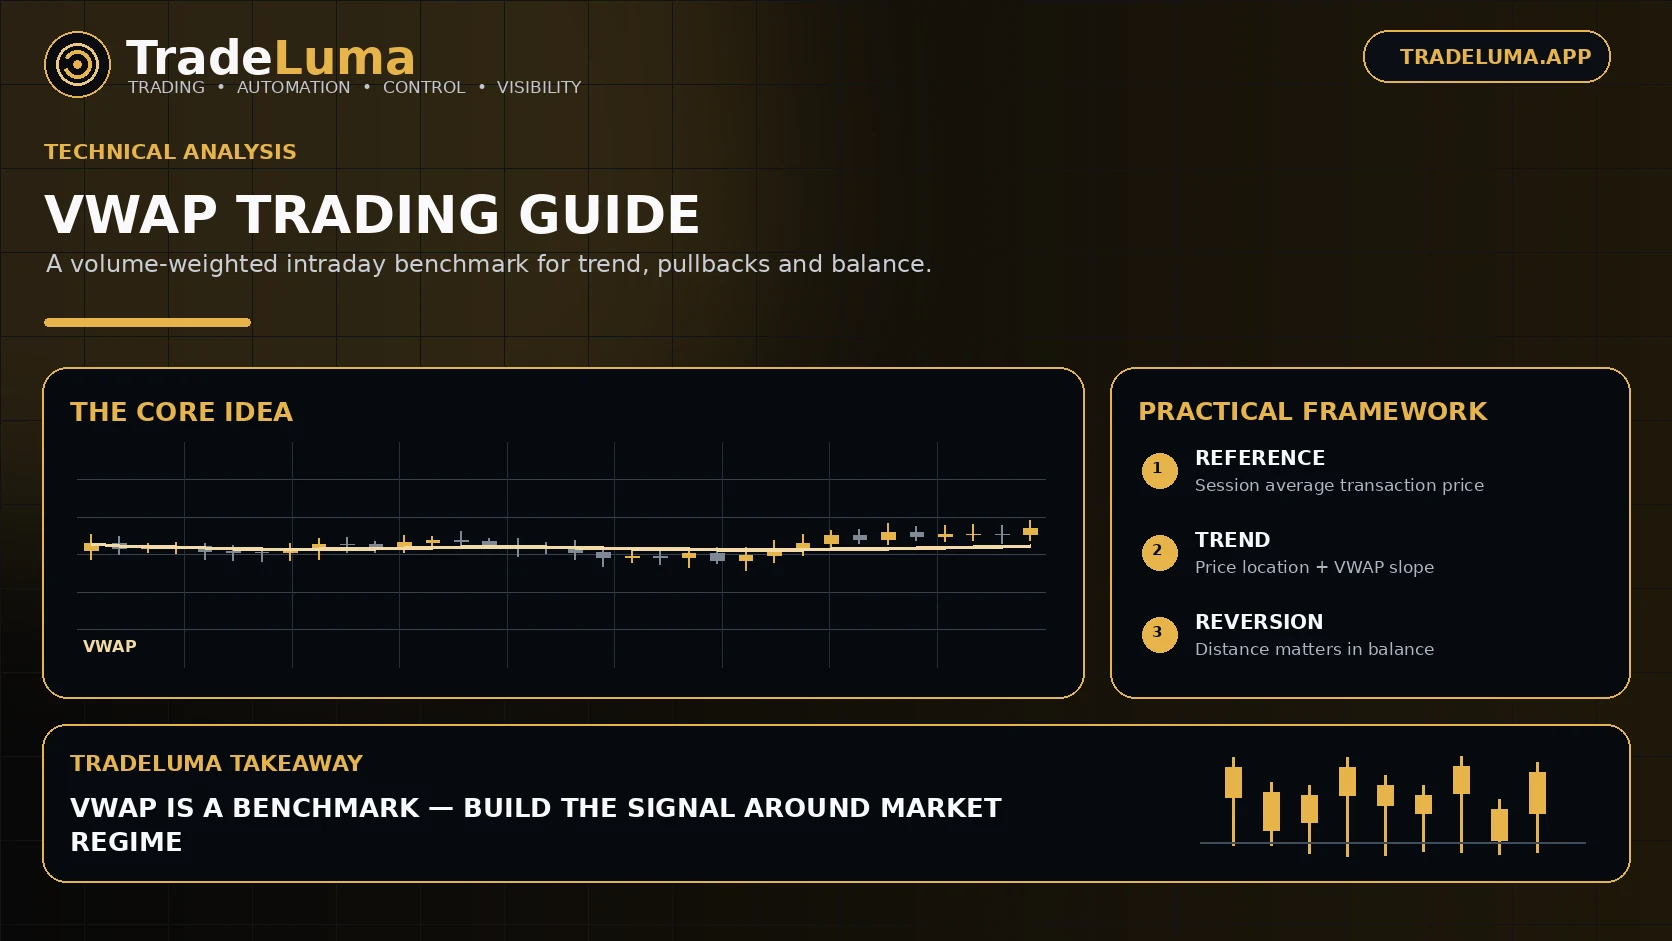
Learn how VWAP works, why intraday traders watch it, and how it can provide context for trend, pullbacks, mean reversion, and execution quality.
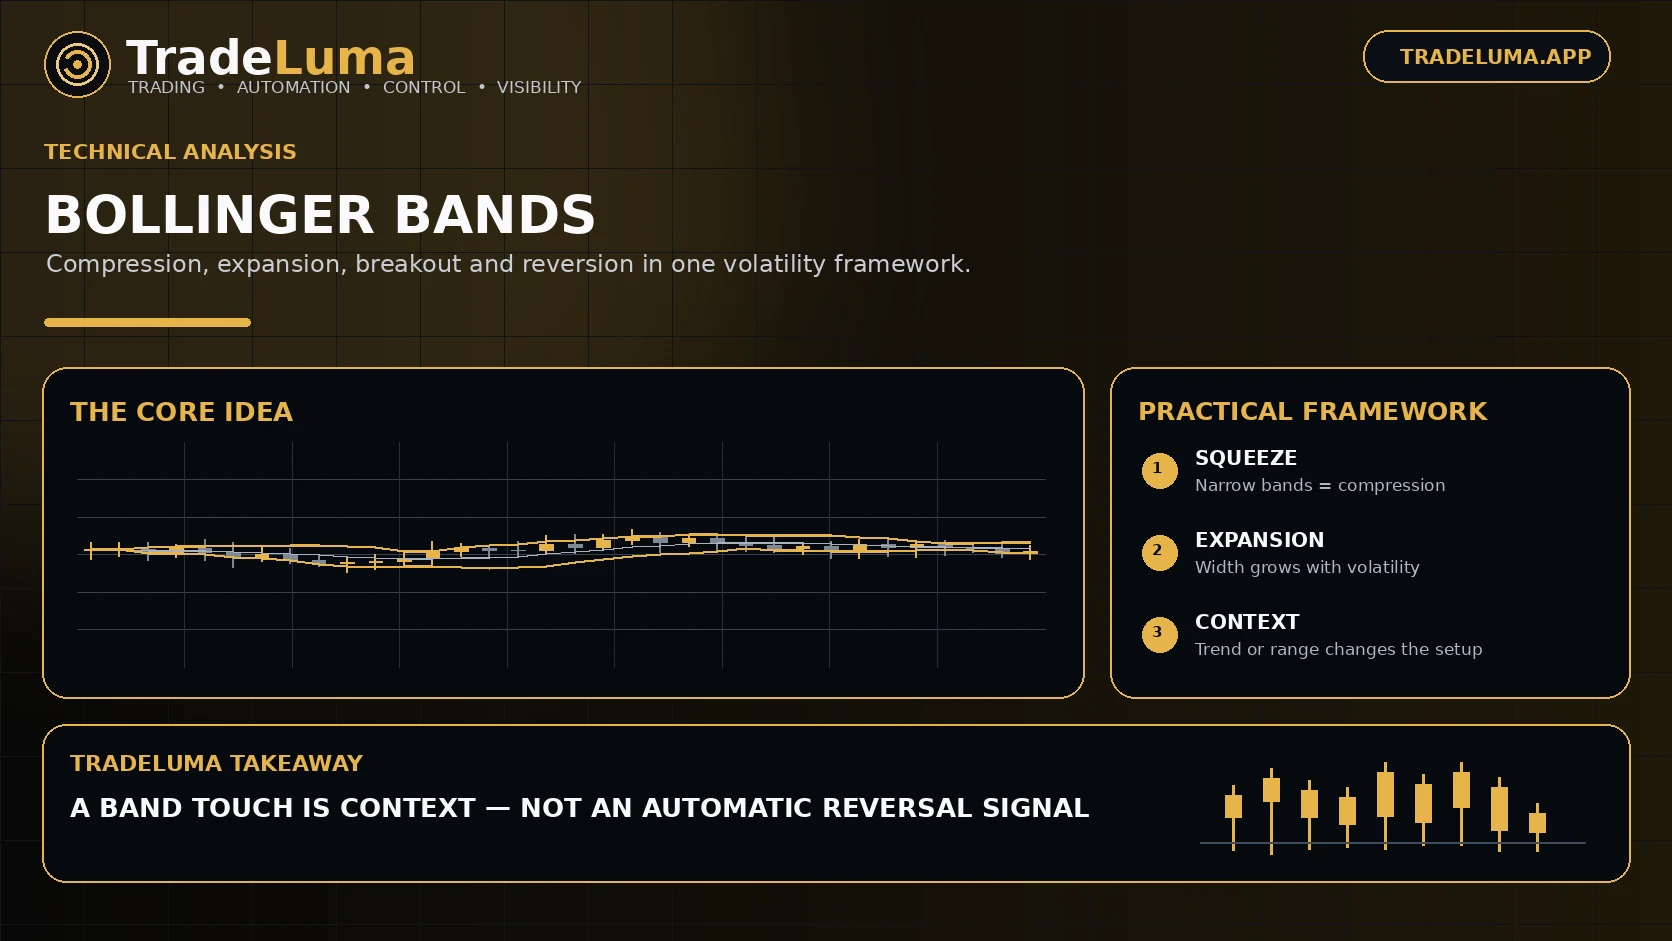
Learn how Bollinger Bands measure relative price and volatility, what a squeeze can indicate, and how traders use the bands for breakouts and mean-reversion setups.
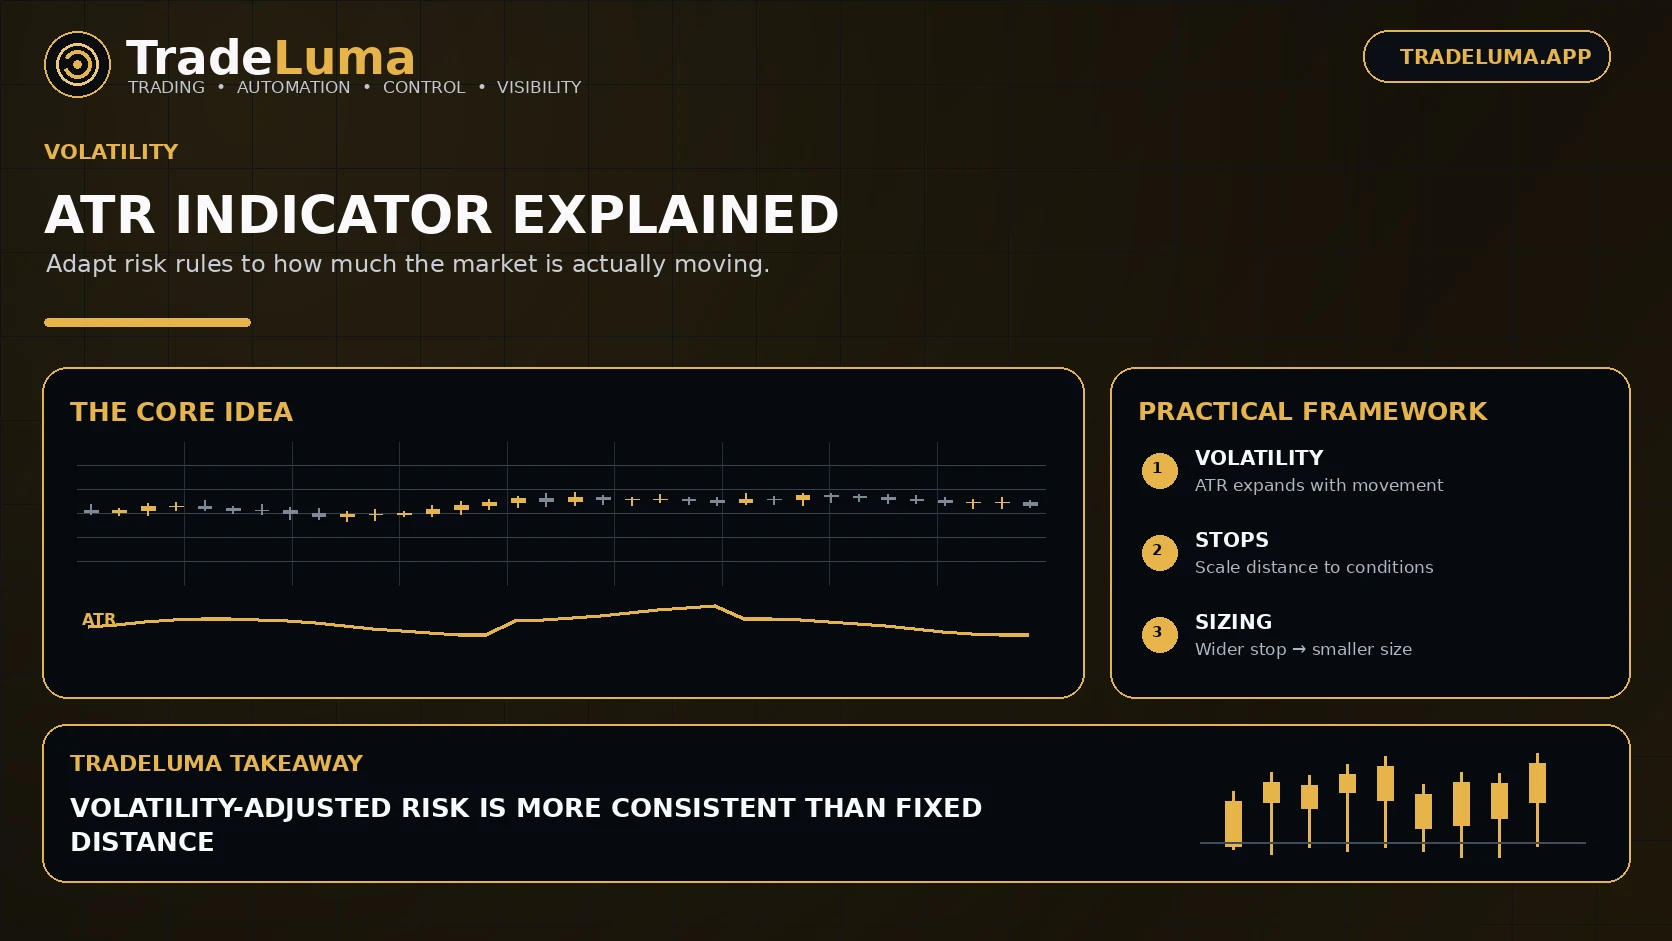
Understand Average True Range (ATR), how traders use it to measure volatility, adapt stop distances, compare market conditions, and support position sizing.
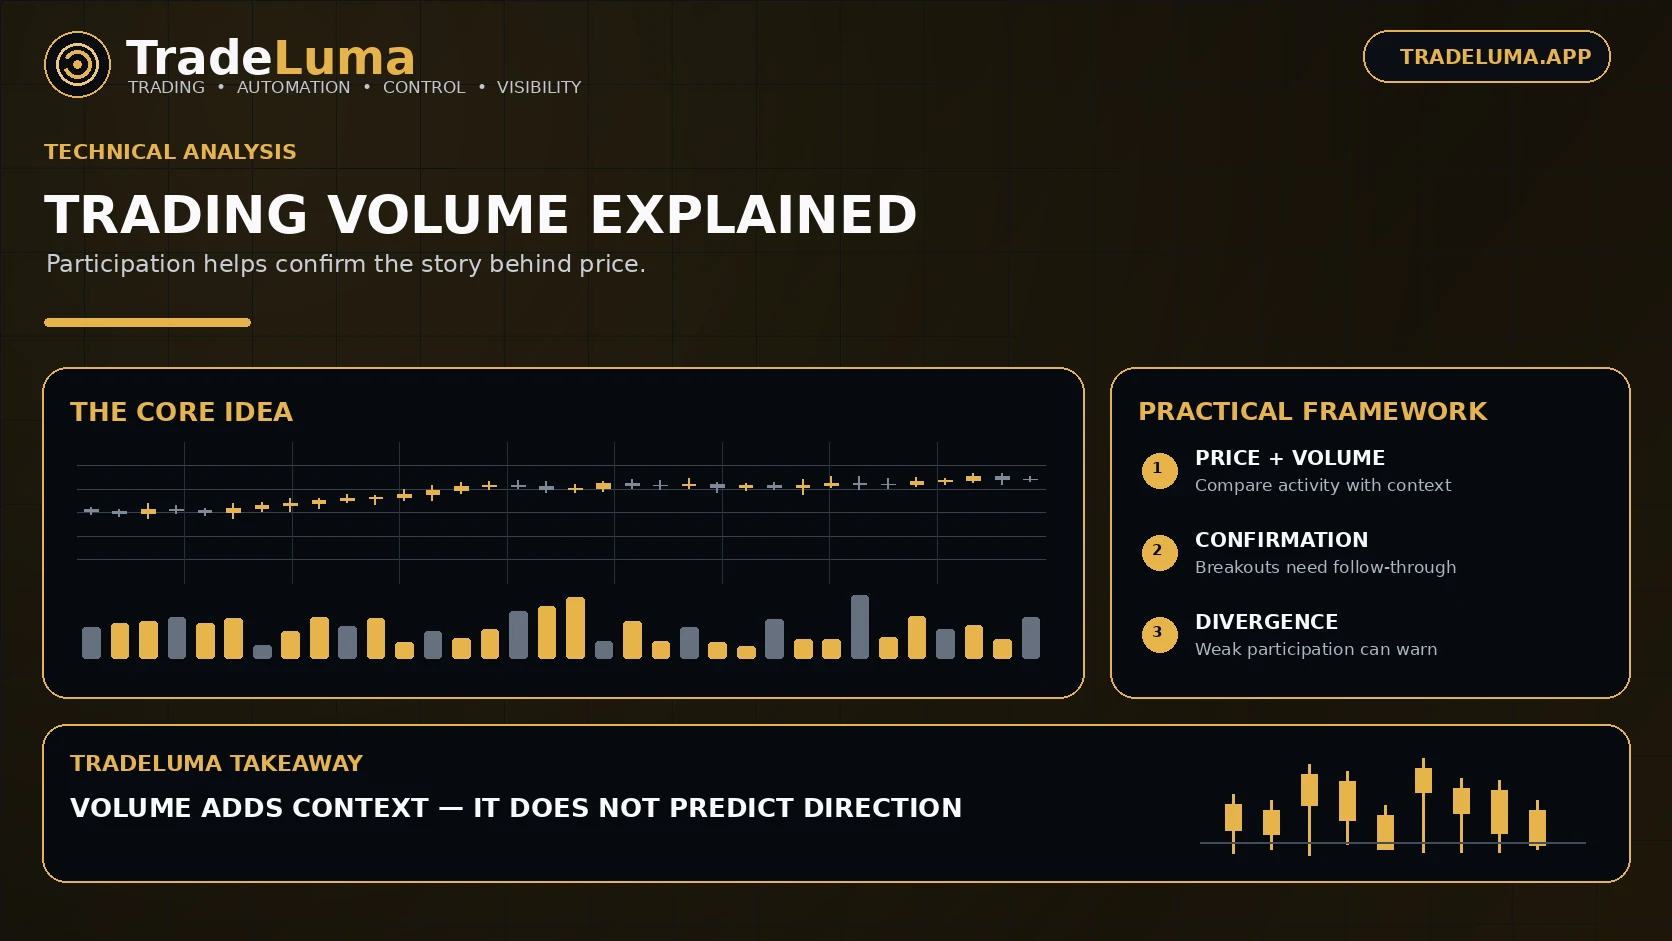
Learn how trading volume can confirm breakouts, reveal weak moves, support trend analysis, and add context to price action without becoming a standalone signal.
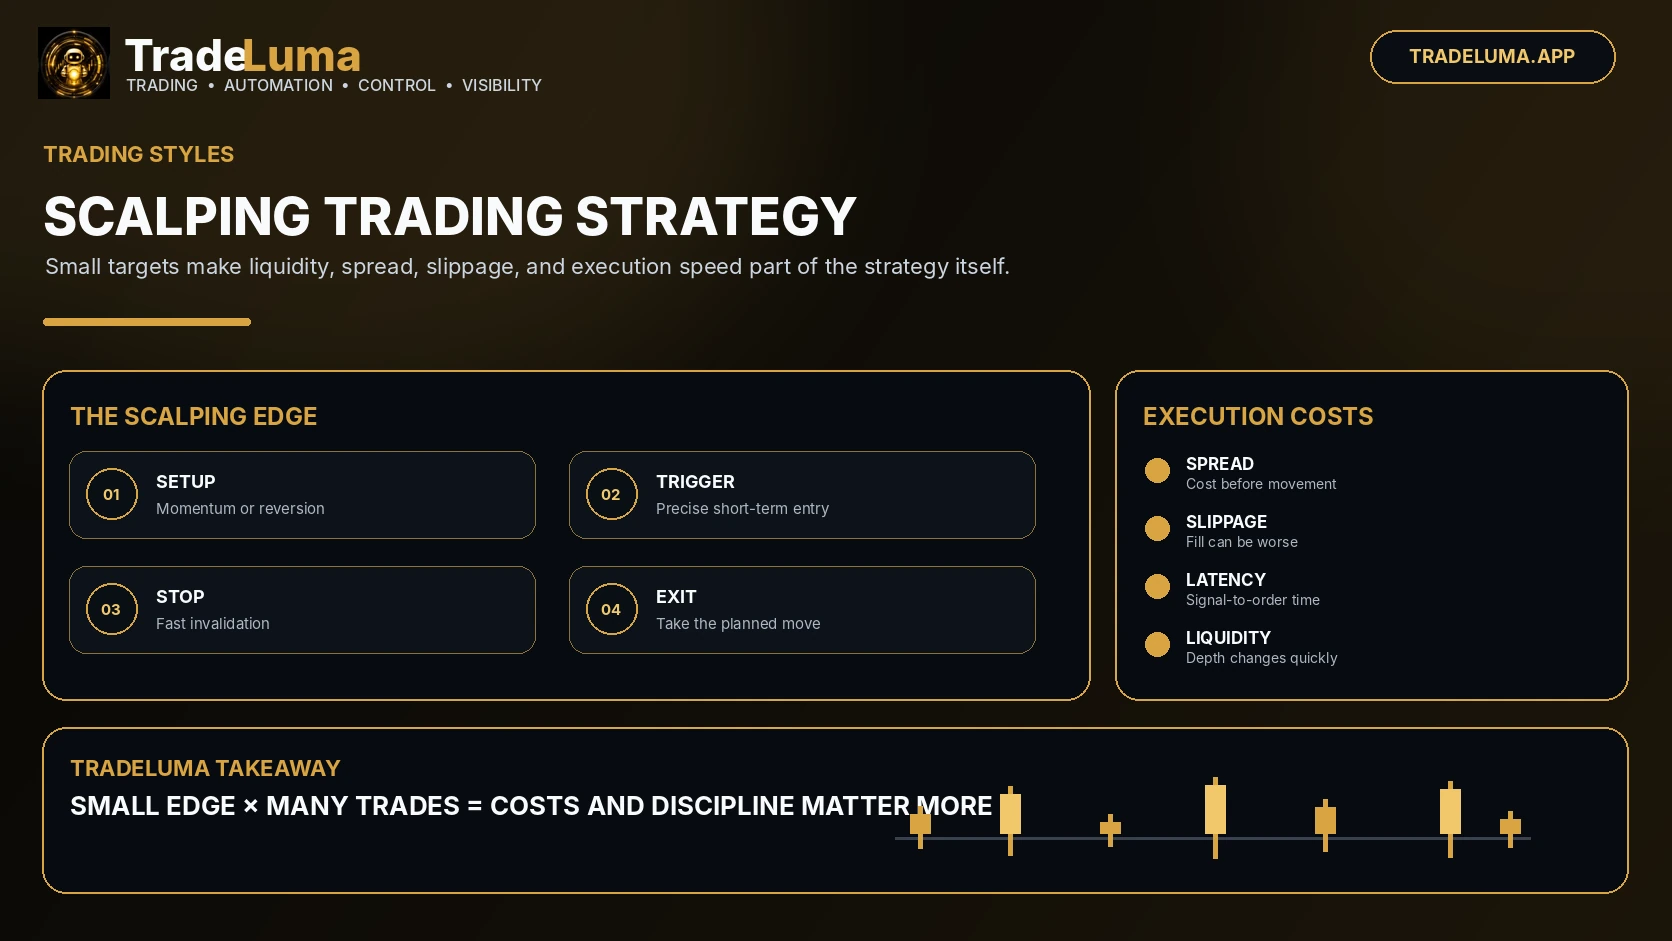
Learn how scalping works, including liquidity, spread, slippage, latency, momentum and mean-reversion setups, plus short-term risk controls.
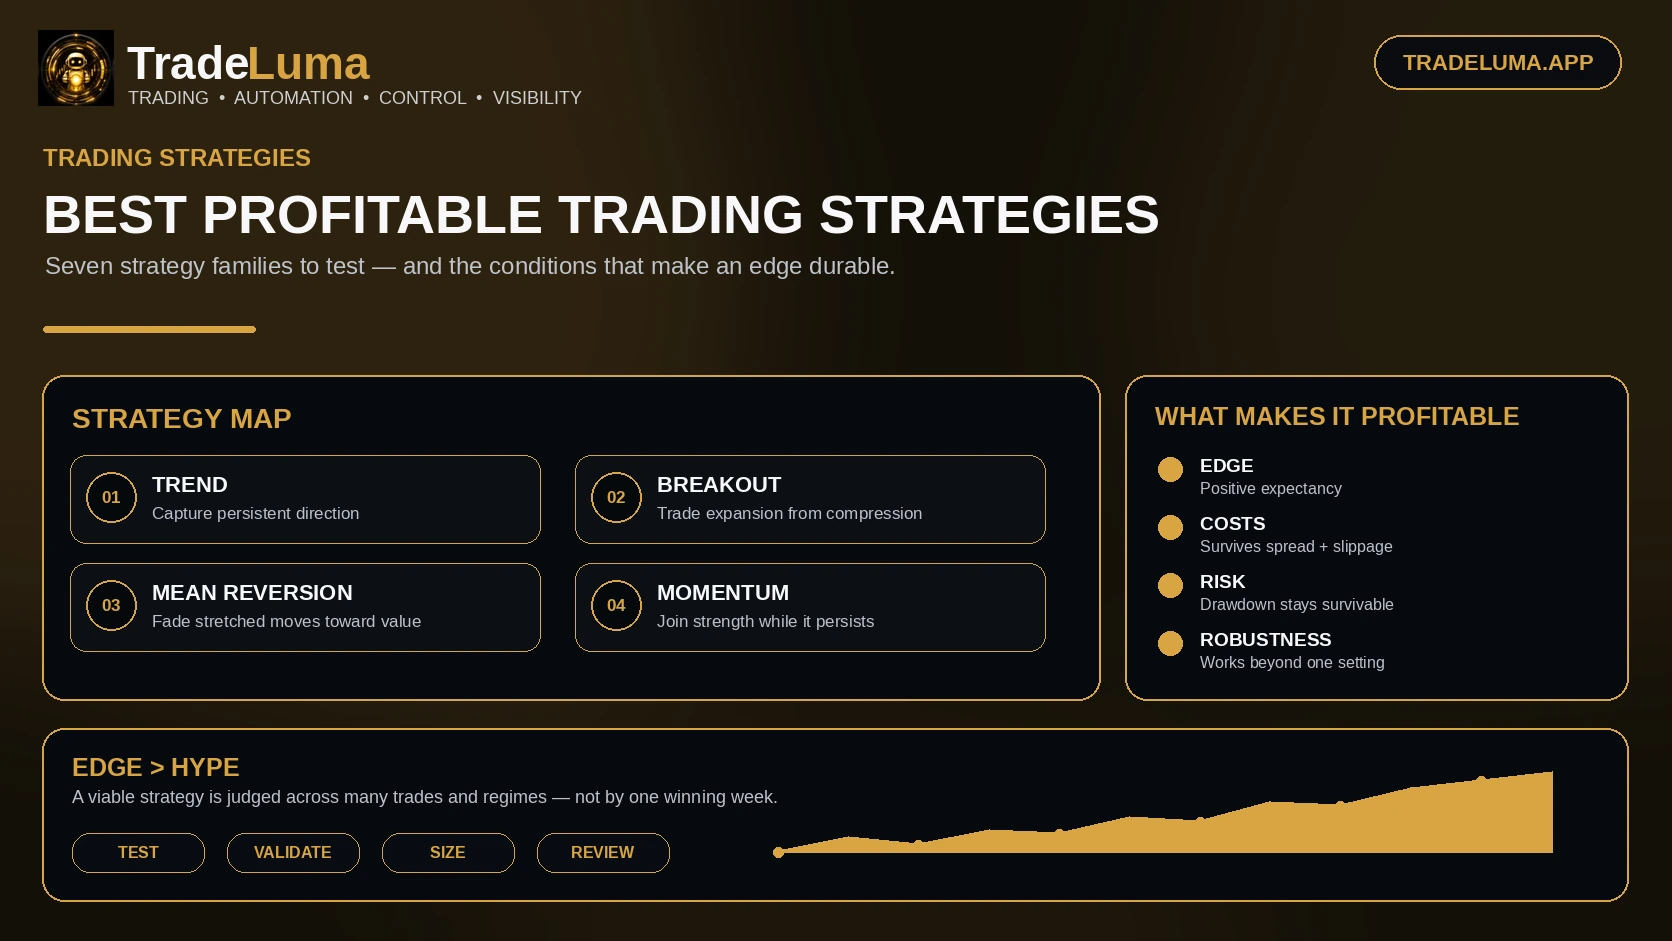
Compare seven widely used trading strategy styles, from trend following and breakouts to mean reversion, momentum, pullbacks, and pairs trading.
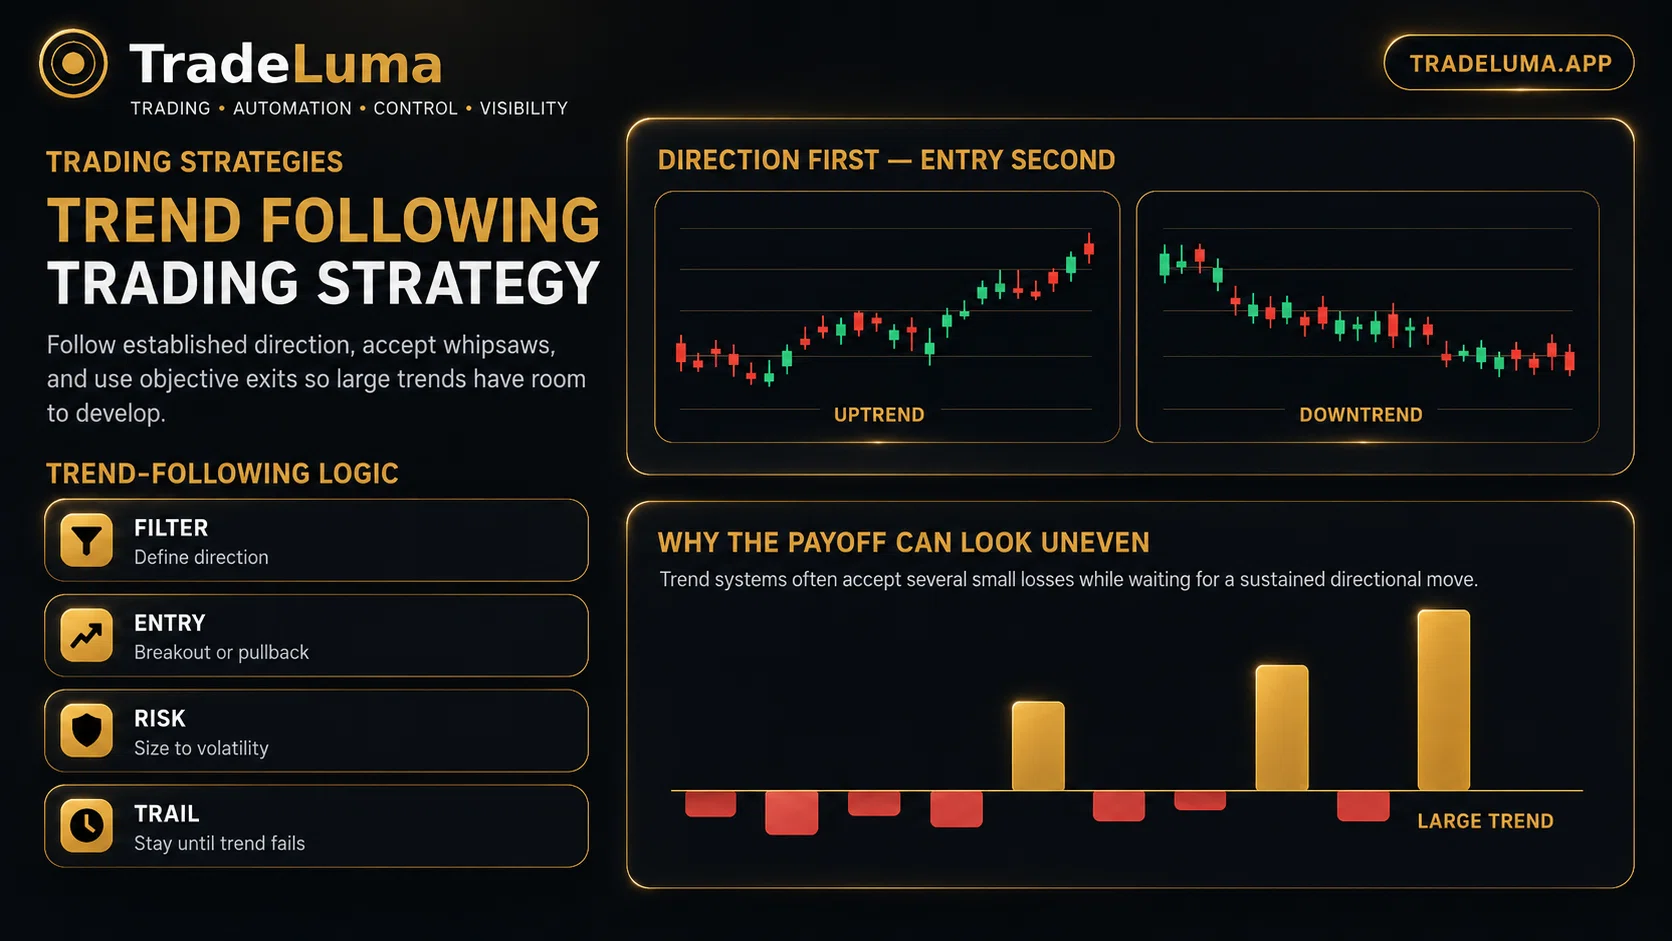
Learn how trend following strategies identify direction, enter pullbacks or breakouts, trail exits, manage whipsaws, and adapt risk to changing market conditions.
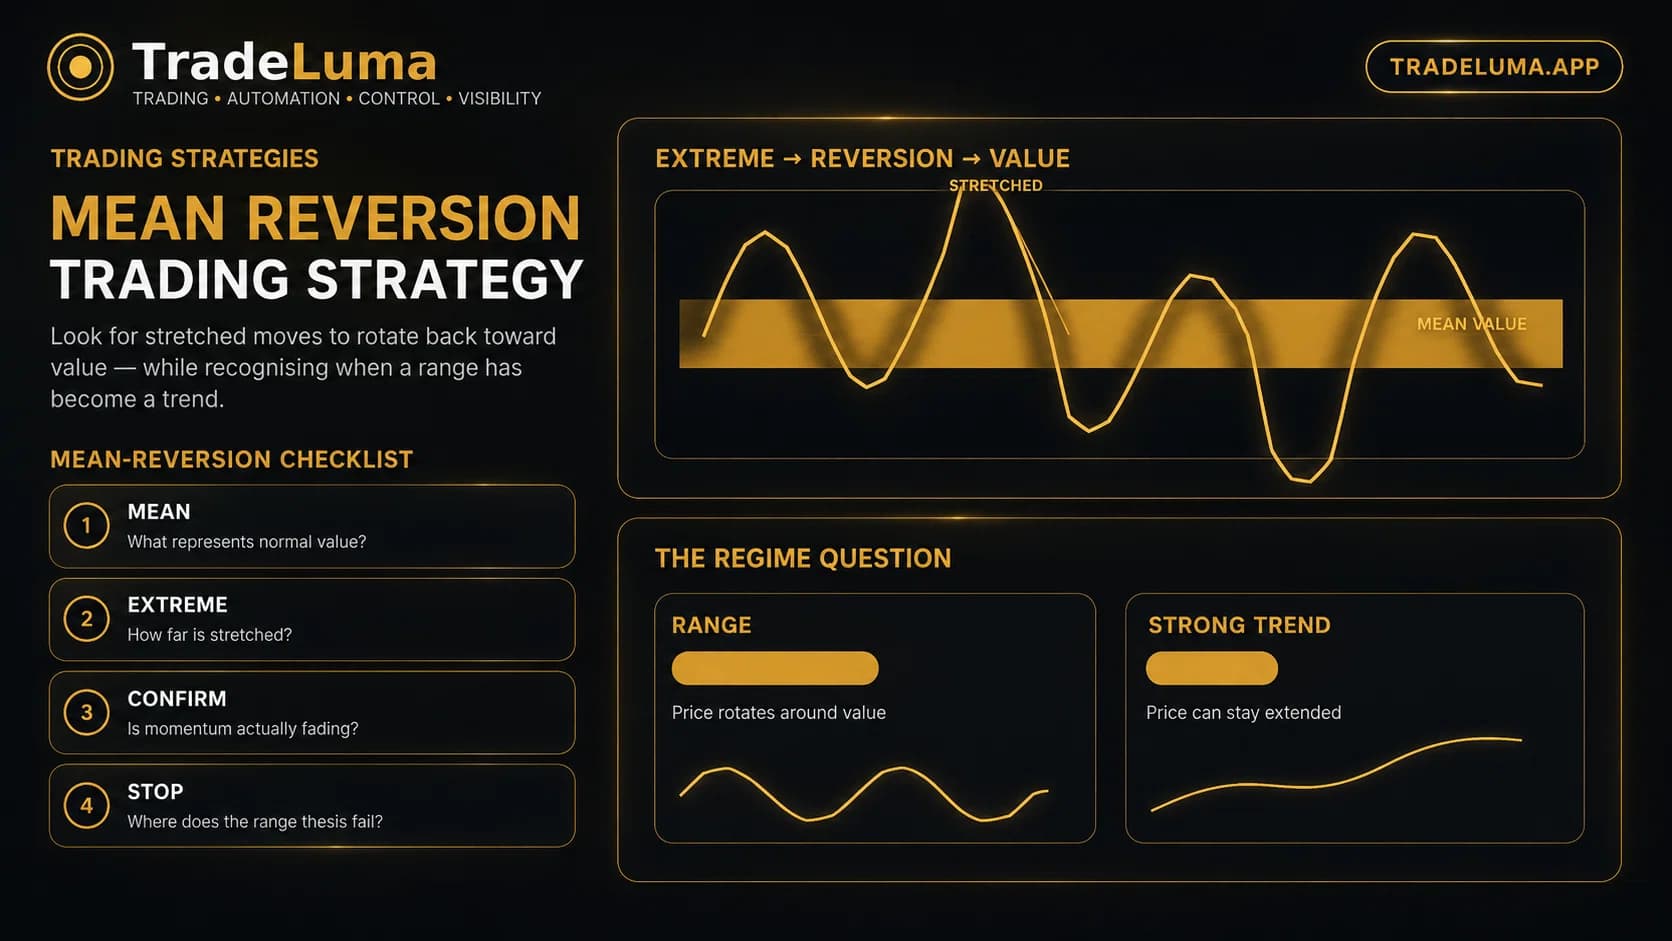
Learn how mean reversion trading works, how traders define a normal price zone, identify stretched moves, manage entries and stops, and avoid fighting strong trends.
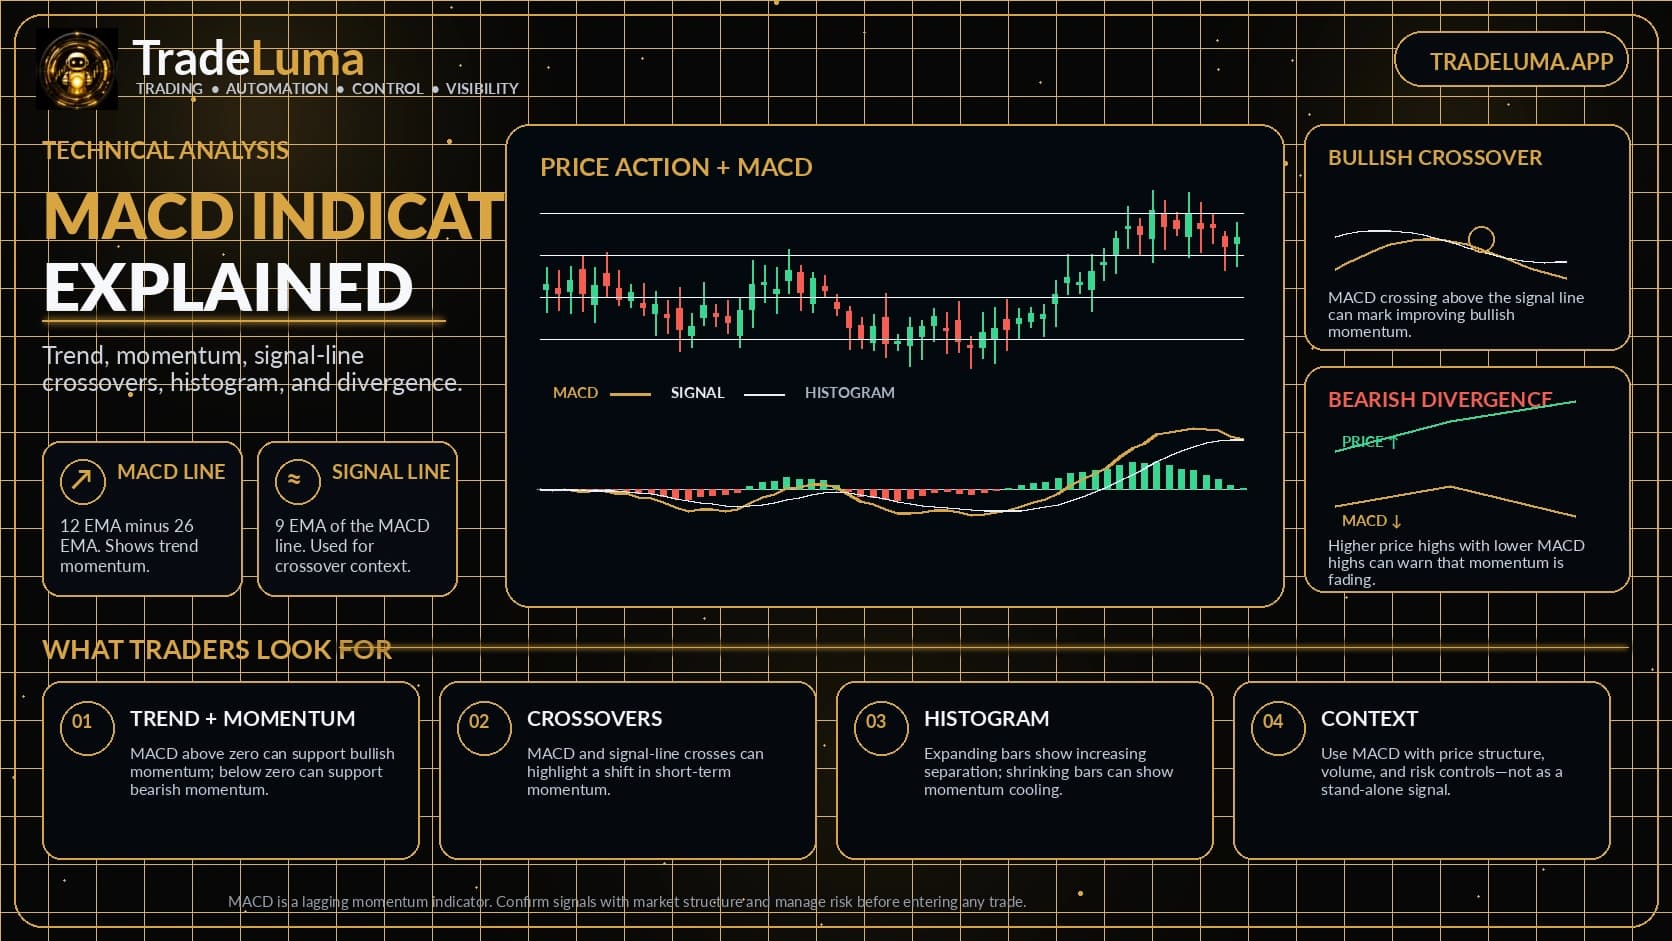
Learn how the MACD indicator works, what the signal line and histogram mean, and how traders read crossovers, zero-line momentum, and divergence.
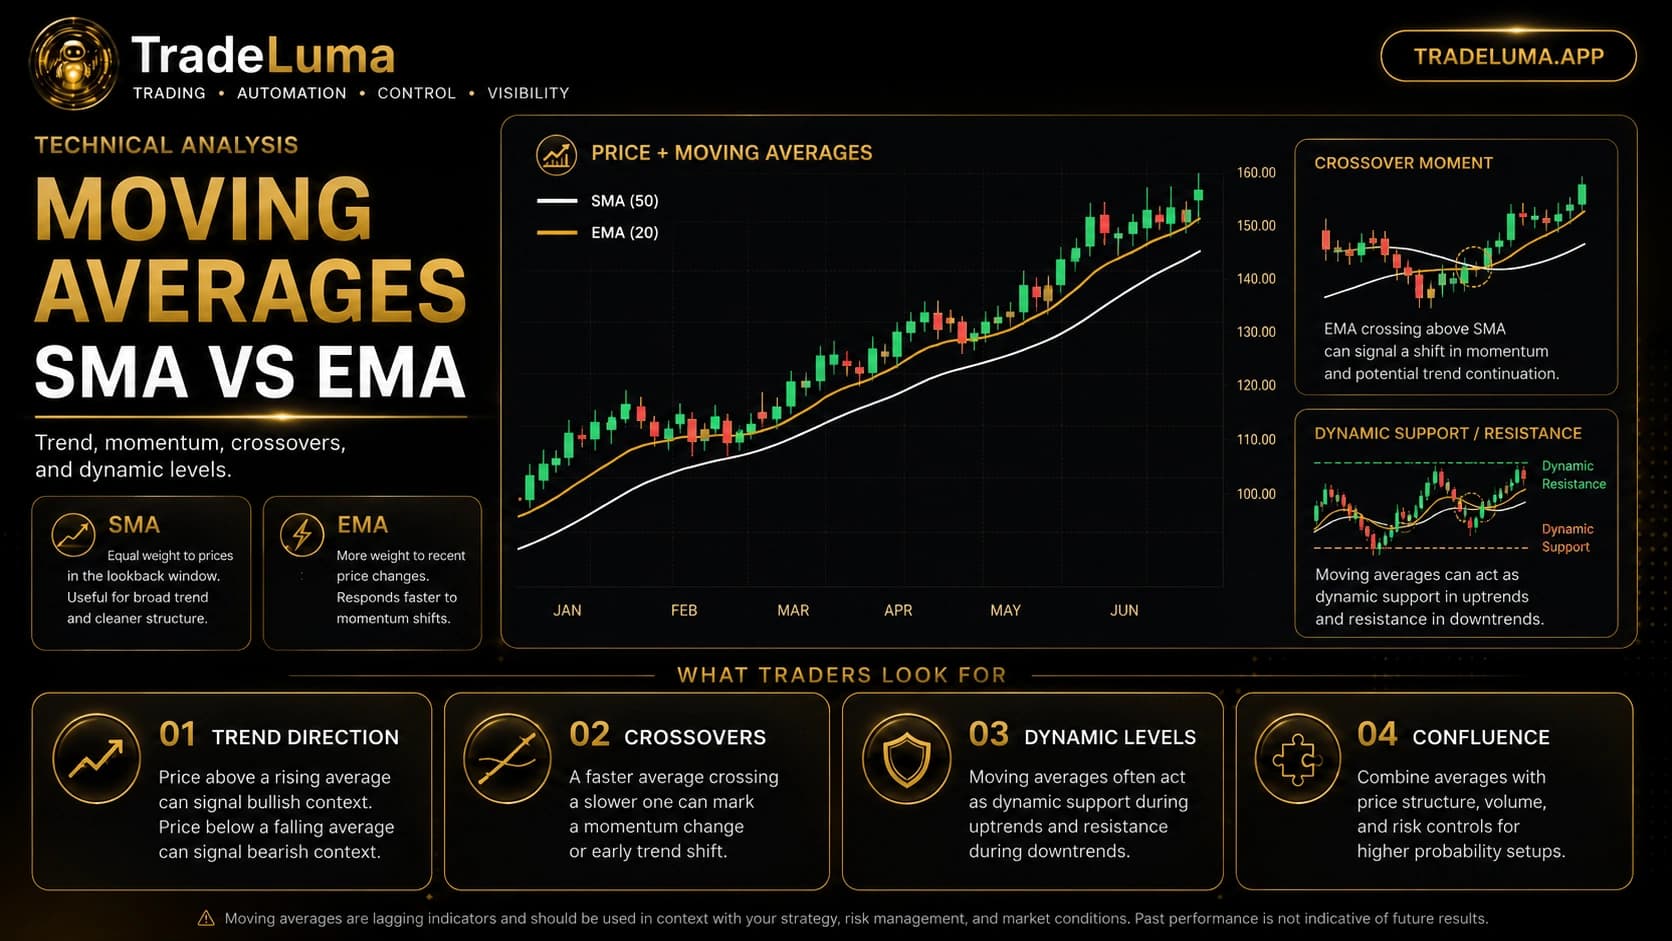
Learn how simple and exponential moving averages work, the difference between SMA and EMA, and how traders use trend, crossovers, and dynamic levels.
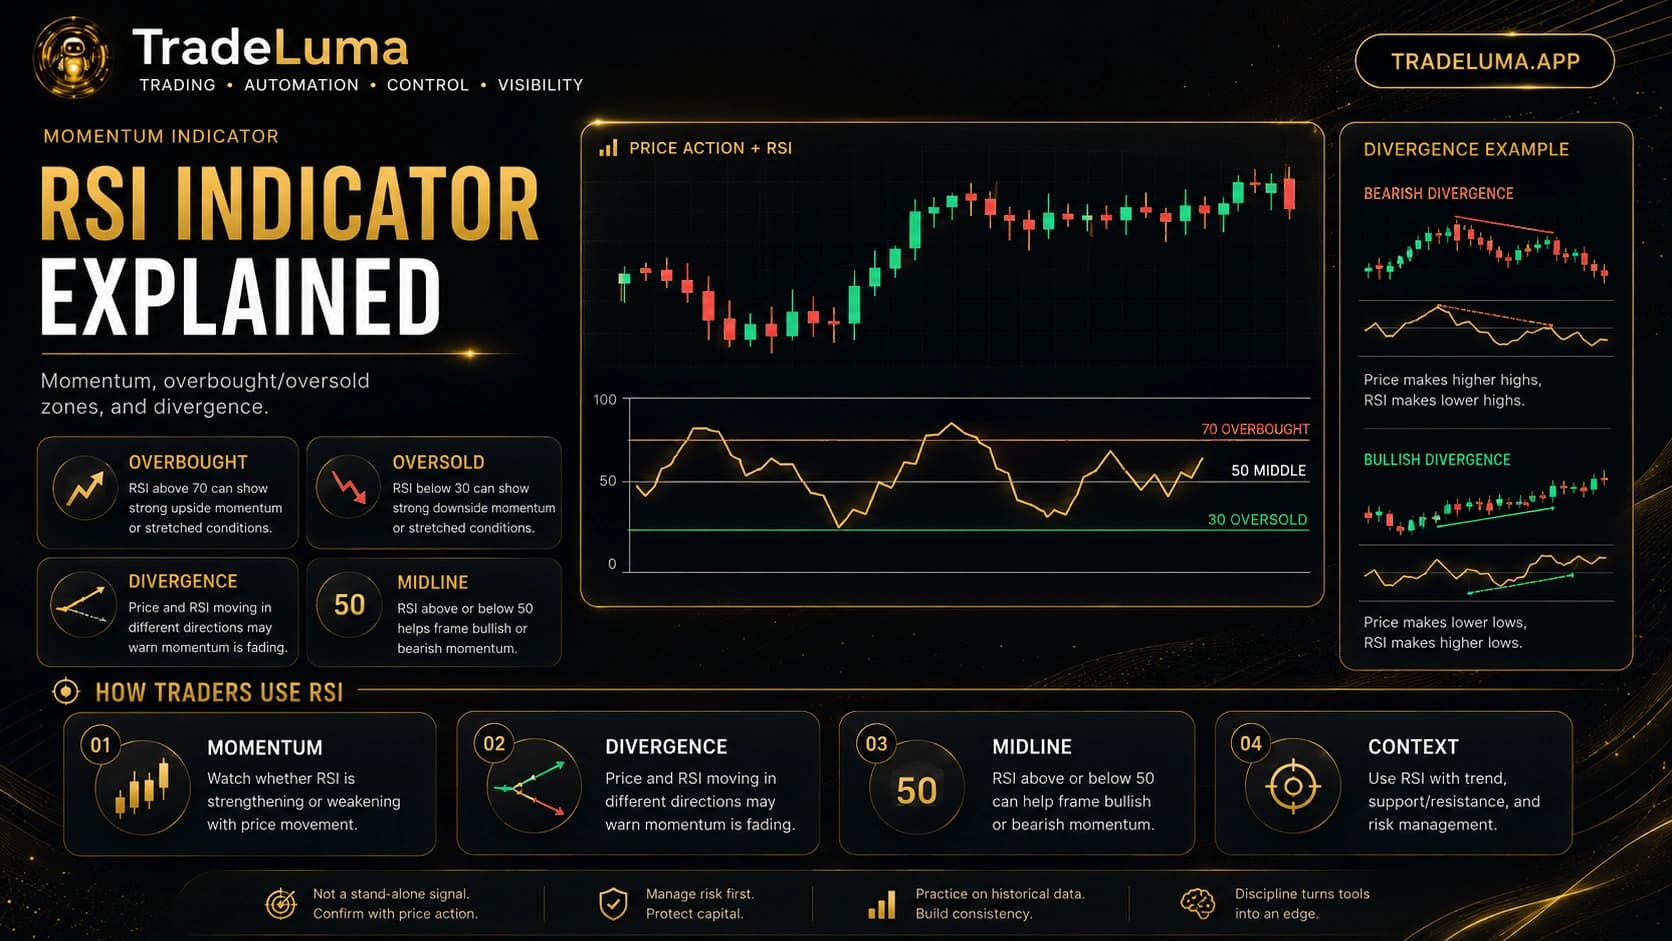
Learn how the RSI indicator works, what overbought and oversold levels mean, how traders use the 50 line, and how RSI divergence can signal momentum shifts.

Create a useful trading journal by linking signals, orders, fills, costs, exits, screenshots, strategy versions, and review notes.