
Trading Foundations
Volatility in Trading Explained: How to Adapt When Markets Speed Up
Learn what trading volatility means, how ATR and realised range measure it, and how volatility affects stops, position size, targets, and execution.
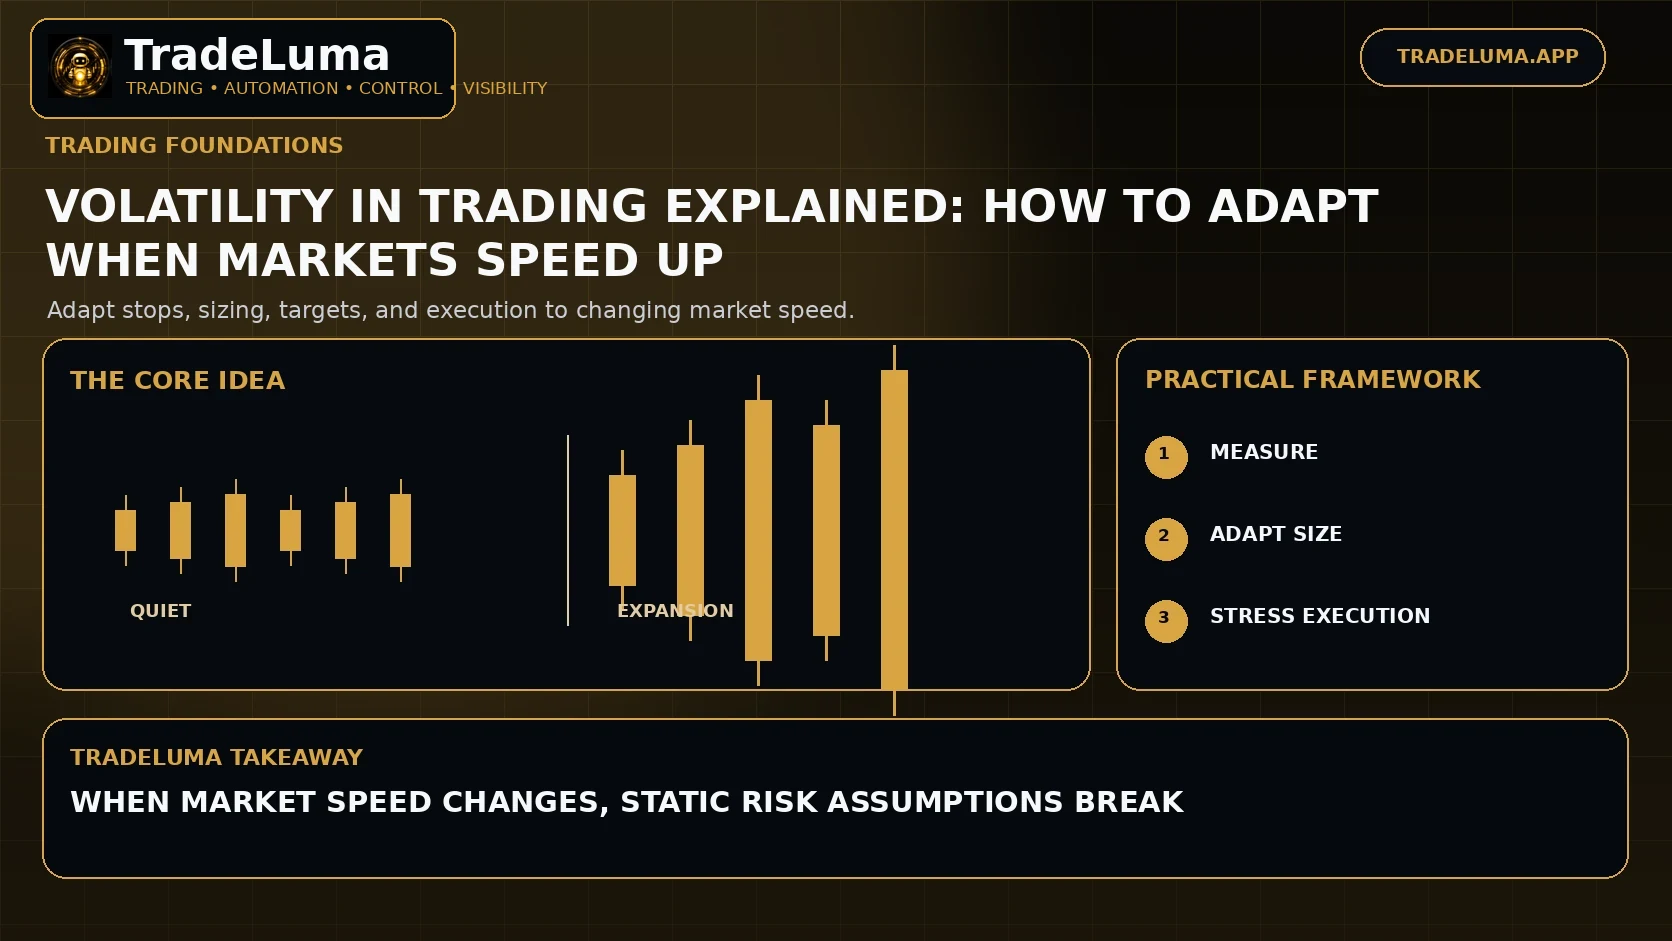
Volatility measures how much and how quickly price changes. High volatility creates larger opportunities and larger risks at the same time: candles expand, stops need more room, slippage can increase, and leverage becomes more dangerous. Low volatility reduces movement but can create compression before a later breakout. Traders benefit from treating volatility as a changing market condition rather than a fixed background assumption.
What volatility measures
Volatility is the degree of price variation over time. A market that moves several percent in a day is more volatile than one that stays inside a narrow range, regardless of whether the direction is up or down.
Traders care because movement determines both opportunity and the distance price can travel against a position before the setup has had time to develop.
ATR and true range
Average True Range measures recent price range while accounting for gaps. It is expressed in price units, which makes it practical for stops, targets, and comparing the current environment with the instrument's own history.
ATR does not say whether price will rise or fall. It only describes how much movement has recently occurred.
Realised and historical volatility
Statistical volatility often uses the standard deviation of returns over a lookback period. This allows volatility to be compared across time or across assets when appropriately normalised.
The chosen lookback matters. A short window reacts quickly to sudden changes, while a long window is smoother but slower to recognise a new regime.
Implied volatility
Options markets contain an implied estimate of future volatility derived from option prices. Implied volatility is not a directional forecast; it reflects the magnitude of movement embedded in option pricing.
Spot, futures, and options traders may watch implied volatility around major events because expected uncertainty can change sharply before and after the announcement.
How volatility affects stops
A stop distance that works in a quiet market can sit inside ordinary noise during a high-volatility period. Volatility-adjusted stops attempt to give the setup enough room without using one fixed distance forever.
Wider stops should generally be paired with smaller size if the trader wants to keep the same planned account risk.
How volatility affects targets
Higher volatility can justify wider targets because the market is capable of travelling farther, while very low volatility may make a distant target unrealistic within the intended holding period.
Targets can scale with ATR, recent range, or volatility bands, but structure and liquidity should still be considered.
Volatility compression and expansion
Markets often alternate between contraction and expansion. Bollinger Band squeezes, falling ATR, and narrow ranges can identify compression, while breakout bars and rising range show expansion.
Compression does not guarantee the breakout direction. A strategy should wait for its chosen directional trigger rather than treating low volatility as automatically bullish or bearish.
Extreme volatility and execution
During extreme moves, spreads can widen, depth can fall, and stops can fill worse than expected. The risk model should therefore consider not only larger price swings but also deteriorating execution quality.
Some strategies reduce size, stop trading, or apply event filters when volatility exceeds a threshold that was rare in the data used to build the system.
Testing volatility regimes
Segment historical trades into low, medium, and high volatility groups using a rule that is known at the time of the trade. Compare win rate, average trade, slippage, drawdown, and holding time across the groups.
If a strategy only works in one regime, a volatility filter may be useful. If the filter is overly tuned, however, it can simply overfit past conditions.
Frequently asked questions
What is volatility in trading?
Volatility describes the size and speed of price changes. It measures movement, not whether the market is bullish or bearish.
Is ATR a volatility indicator?
Yes. ATR measures recent true range in price units and is commonly used to adapt stops, targets, and position size.
Is high volatility good or bad for traders?
It can create larger opportunities but also larger losses, wider spreads, more slippage, and greater stop risk. Whether it is favourable depends on the strategy.
What is volatility compression?
Volatility compression is a period of unusually narrow price movement. It can precede expansion, but it does not predict the breakout direction by itself.
Continue learning
Related TradeLuma guides
Trading Foundations
How to become a profitable trader: process, risk, and consistency
11 Aug 2026 · 13 min read
Trading Foundations
Liquidity in Trading Explained: Why It Matters for Entries and Exits
7 Sept 2026 · 11 min read
Trading Foundations
Common Trading Mistakes to Avoid: Risk, Discipline and Execution
30 Aug 2026 · 12 min read
Build a controlled automation workflow with TradeLuma
Configure alerts, test in paper mode, apply execution controls, and follow broker outcomes from one workspace.