
Technical Analysis
Moving averages explained: SMA vs EMA in trading
Learn how simple and exponential moving averages work, the difference between SMA and EMA, and how traders use trend, crossovers, and dynamic levels.
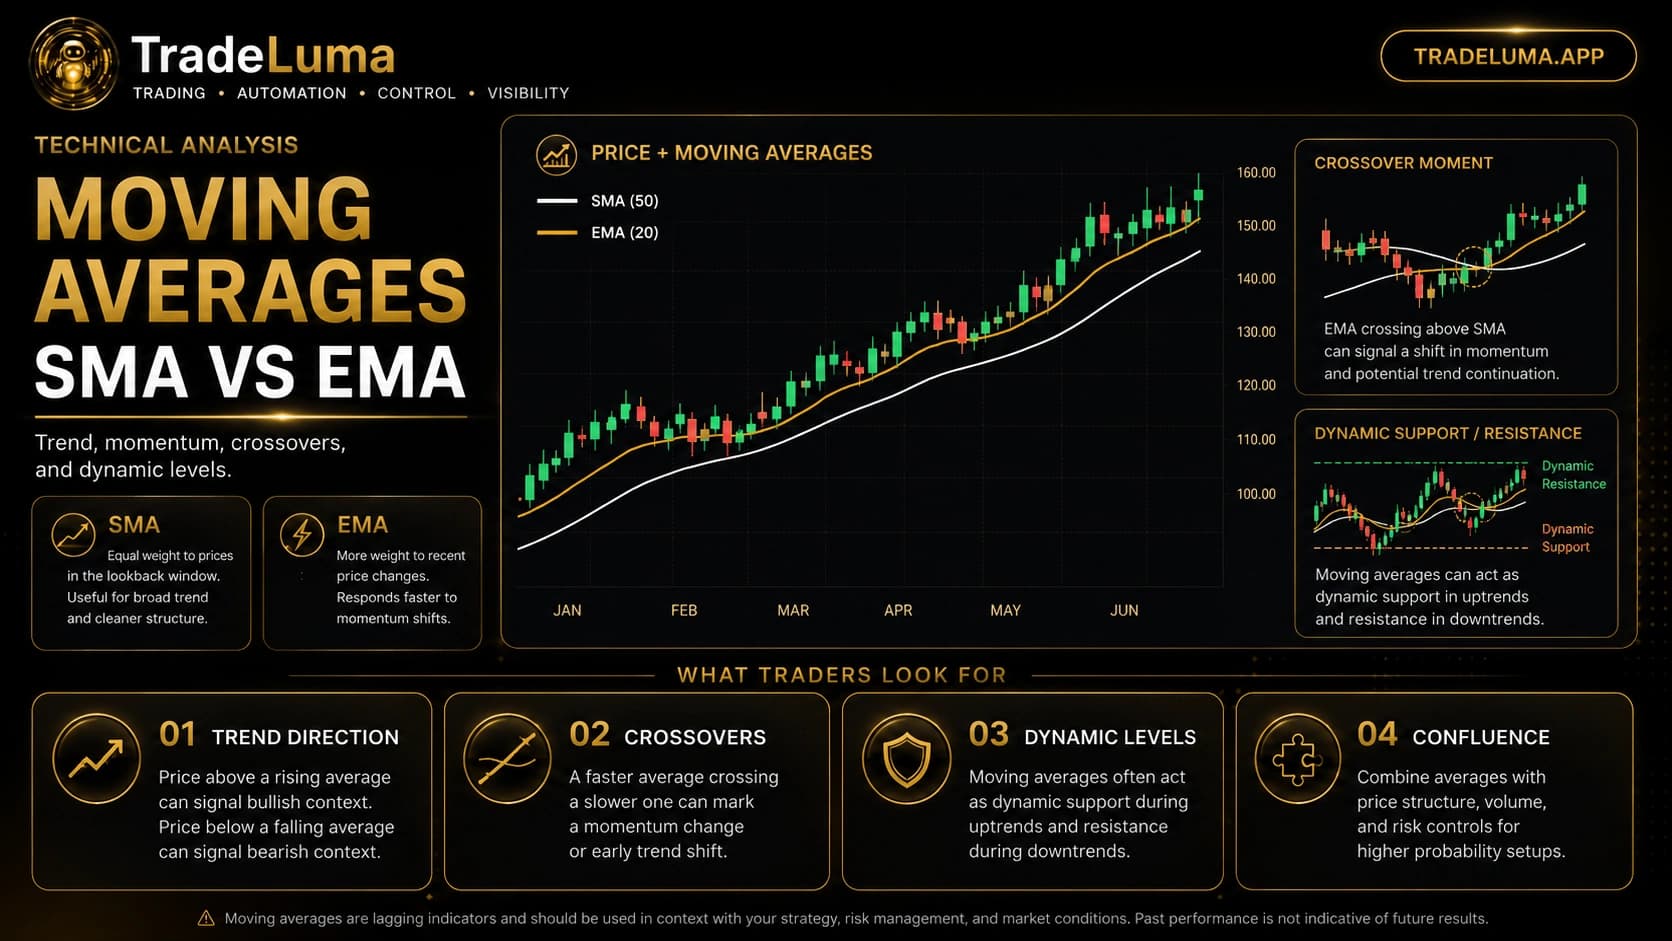
Moving averages are among the most widely used tools in technical analysis because they make trend direction easier to see. Instead of reacting to every individual candle, a moving average smooths a chosen number of prices into one evolving line. Traders use that line to judge whether momentum is strengthening or weakening, compare short-term and long-term trends, and identify areas where price may react. The two most common versions are the simple moving average, or SMA, and the exponential moving average, or EMA.
What a moving average actually measures
A moving average calculates an average price over a rolling lookback window. When a new candle is added, the calculation updates and the line moves with the market. A 20-period average therefore describes a shorter slice of recent price action than a 200-period average, which tends to change much more slowly.
The main benefit is visual clarity. Price is noisy, especially on shorter timeframes. A moving average filters some of that noise and helps the trader see the broader direction. The trade-off is lag: because the calculation uses historical prices, the line responds after price has already moved.
SMA vs EMA: what is the difference?
A simple moving average gives every price in the lookback window the same weight. If the period is 20 candles, each candle contributes equally to the final average. That makes the SMA smooth and easy to interpret, but it can react slowly when market conditions change quickly.
An exponential moving average places more weight on recent prices. As a result, the EMA usually follows price more closely and responds faster to fresh momentum. That faster reaction can be useful for shorter-term trading, but it may also create more whipsaws in sideways markets because the line responds to smaller price changes.
How traders use moving-average slope and price position
One simple use is to compare price with the moving average and observe the direction of the line. Price holding above a rising average can support a bullish trend interpretation, while price staying below a falling average can support a bearish interpretation. A flat average often reflects a market that lacks clear directional momentum.
This is context rather than a complete strategy. Price can cross an average many times inside a range, and strong trends can move far away from the average before eventually returning. Traders therefore combine the line with market structure rather than assuming every cross has the same meaning.
Moving-average crossovers explained
A crossover compares two moving averages with different speeds. A shorter-period average reacts faster, while a longer-period average moves more slowly. When the faster average crosses above the slower one, traders may interpret that as improving upward momentum. A cross below can indicate weakening momentum or a developing downtrend.
Popular examples include 20/50, 50/200, and other combinations chosen for a particular timeframe. The exact periods are less important than understanding the purpose: one line represents the faster trend and the other represents the slower trend. Crossovers can arrive late after a sharp move and can generate repeated false signals when price is ranging.
Can moving averages act as support or resistance?
In established trends, traders often notice price reacting near frequently watched averages. A rising EMA or SMA may act as a dynamic area of support during pullbacks, while a falling average may behave like dynamic resistance during rallies. The line moves as new prices are added, so it is different from a fixed horizontal level.
The reaction is not guaranteed. A moving average becomes more meaningful when it aligns with other structure such as a prior breakout level, swing high or low, trendline, or high-volume area. Confluence can make the decision process clearer, but every level can still fail.
Common moving-average mistakes
One mistake is using too many averages until the chart becomes difficult to read. Another is optimising periods only because they fitted historical data well. A third is treating a crossover as an automatic order without considering whether the market is trending or ranging.
Traders can also enter too late after a long move simply because a slow average finally confirms the trend. Moving averages describe what price has already done, so entries still need realistic structure, risk, and reward planning.
Choosing an SMA or EMA for your workflow
There is no universal winner between SMA and EMA. Traders who want a smoother view of the broader trend may prefer an SMA. Traders who want faster sensitivity to recent price changes may prefer an EMA. Some use both, especially when comparing short-term momentum with longer-term trend structure.
The better choice is the one that matches the strategy and timeframe and remains understandable in live conditions. It should be tested on historical and out-of-sample data rather than selected only because it looks attractive on a few charts.
Use moving averages as context, not certainty
Moving averages are useful because they turn noisy price action into a clearer trend framework. They can help traders recognise direction, pullbacks, crossovers, and momentum changes without needing to predict every candle.
Their strongest role is usually supportive: identify the trend, compare the current price with that trend, combine the information with structure and volume, and then apply a separate risk plan. That keeps the indicator useful without asking it to do more than it can.
Frequently asked questions
What is the difference between SMA and EMA?
An SMA weights all prices in its lookback period equally. An EMA gives greater weight to recent prices, so it usually reacts faster to changes in momentum.
Which moving average is best for trading?
There is no single best moving average. The useful period and type depend on the instrument, timeframe, strategy, and whether the trader wants faster sensitivity or smoother trend information.
What is a moving-average crossover?
A crossover occurs when a faster moving average moves above or below a slower moving average. Traders use it as a momentum or trend signal, but it can be late or noisy in sideways markets.
Are moving averages leading or lagging indicators?
They are lagging indicators because they are calculated from historical prices. They help describe current trend and momentum rather than predicting the future with certainty.
Continue learning
Related TradeLuma guides
Technical Analysis
Stochastic Oscillator Explained: Overbought, Oversold and Crossovers
9 Sept 2026 · 10 min read
Technical Analysis
ADX Indicator Explained: How to Measure Trend Strength
28 Aug 2026 · 10 min read
Technical Analysis
VWAP Trading Guide: Using Volume-Weighted Average Price Intraday
27 Aug 2026 · 11 min read
Build a controlled automation workflow with TradeLuma
Configure alerts, test in paper mode, apply execution controls, and follow broker outcomes from one workspace.