
Indicators
Heikin Ashi trading guide: what these candles show and how traders use them
A practical guide to Heikin Ashi candles, how they differ from standard candlesticks, and when traders use them to simplify trend reading.
On this page+
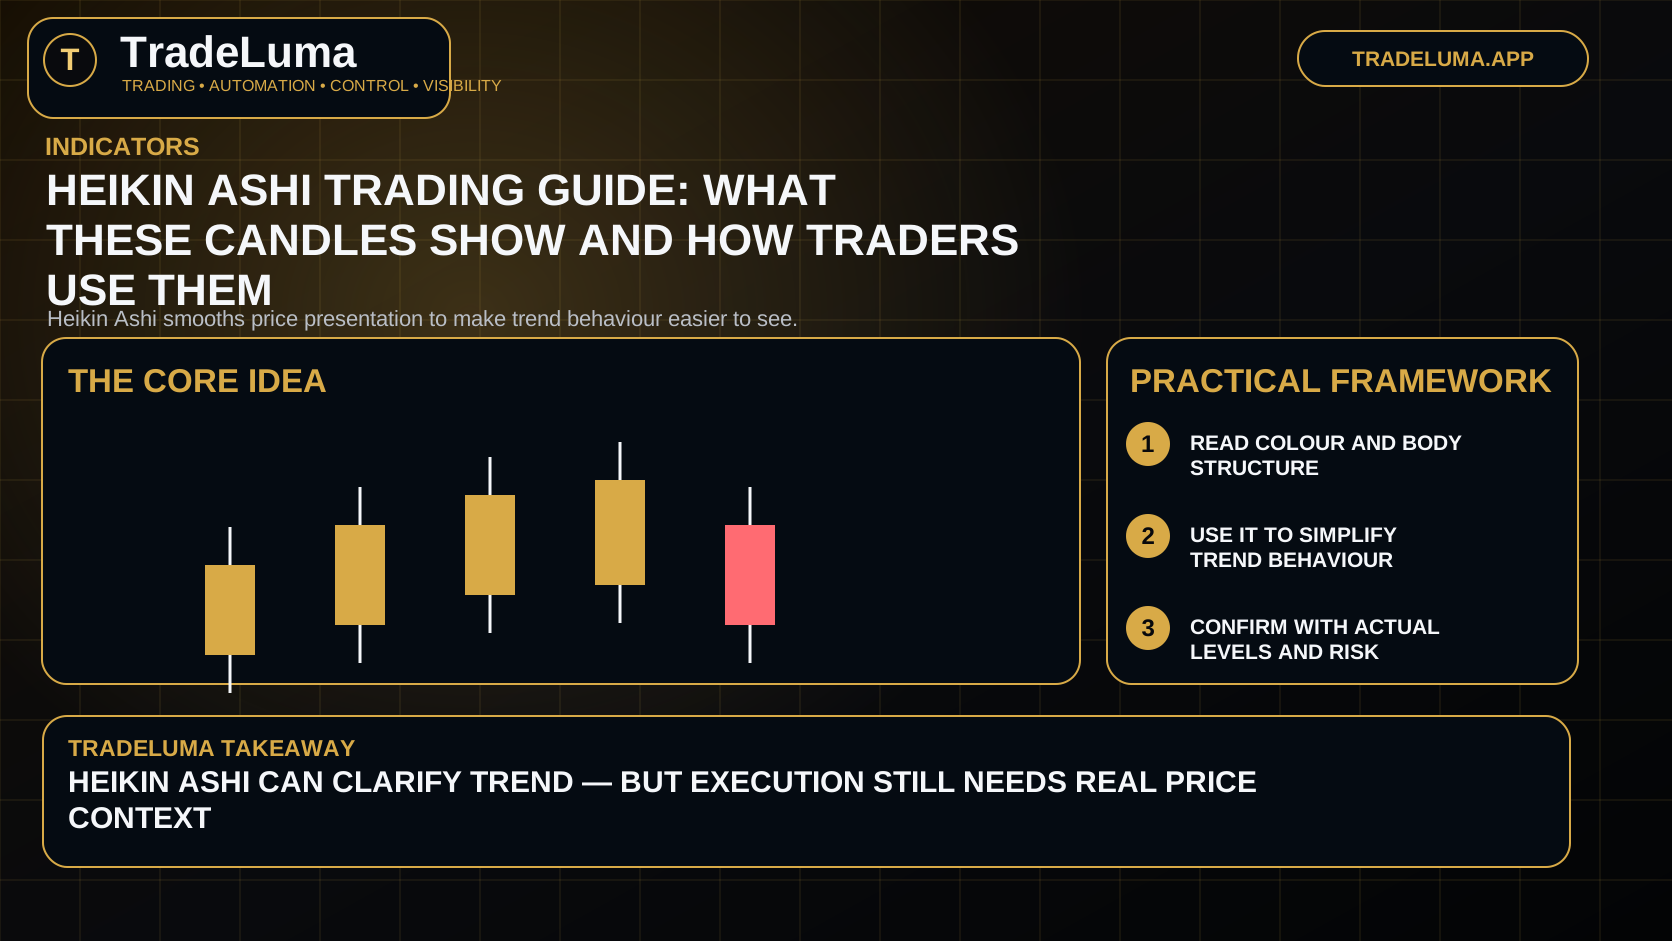
A practical guide to Heikin Ashi candles, how they differ from standard candlesticks, and when traders use them to simplify trend reading. Heikin Ashi smooths price presentation to make trend behaviour easier to see.
What Heikin Ashi is
Heikin Ashi uses a modified candle calculation designed to smooth price action and reduce visual noise.
Because the candles are averaged differently from standard candlesticks, they often show trend persistence more clearly.
Why traders use it
Many traders like Heikin Ashi because it can simplify trend recognition and make it easier to stay with a move rather than react to every small retracement.
It is often used as a visual aid rather than a complete system on its own.
What the candles may suggest
Long same-colour candles can suggest directional strength, while smaller candles or a change of colour can suggest slowing momentum or transition.
The presence or absence of wicks may also be used as additional context, depending on the trading method.
Important limitation
Heikin Ashi candles are derived values, not the actual open and close of the underlying bar.
That means traders still need awareness of real market prices when placing orders, measuring stop distance, and reviewing execution.
How traders combine it
Heikin Ashi often works best alongside support and resistance, moving averages, or market structure rather than in isolation.
It can improve visual clarity, but the trading edge still comes from rules, context, and risk management.
Frequently asked questions
What is the difference between Heikin Ashi and candlesticks?+
Heikin Ashi uses a modified calculation to smooth price, while standard candlesticks show the actual open, high, low, and close of each period.
Is Heikin Ashi good for trend trading?+
Many traders use it for trend trading because it can make directional behaviour easier to read.
Can I place trades from Heikin Ashi alone?+
It is generally better to keep actual price levels and risk rules in view because the candles do not directly represent raw market prices.
Trading indicators
Continue with the topic hub.
Browse the related TradeLuma guides and build the topic from foundations through practical application.
Explore Trading indicators guides →Continue learning
Related guides.
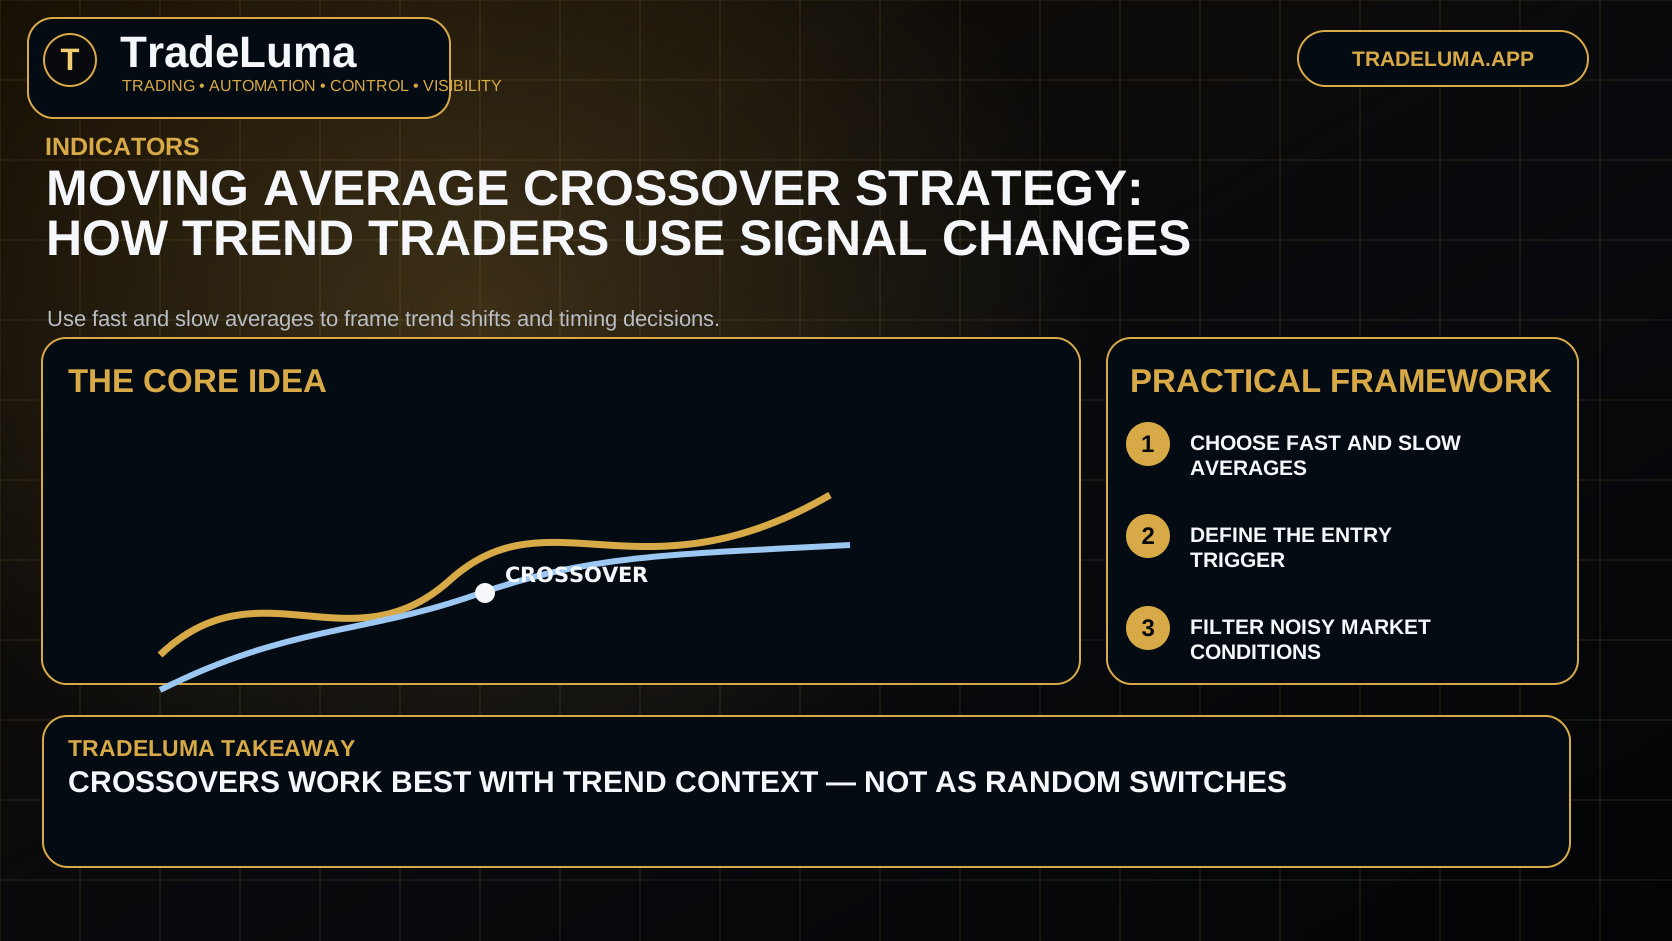
Moving average crossover strategy: how trend traders use signal changes
Learn how moving average crossover strategies work, what the signals mean, and how traders reduce whipsaws with structure and context.
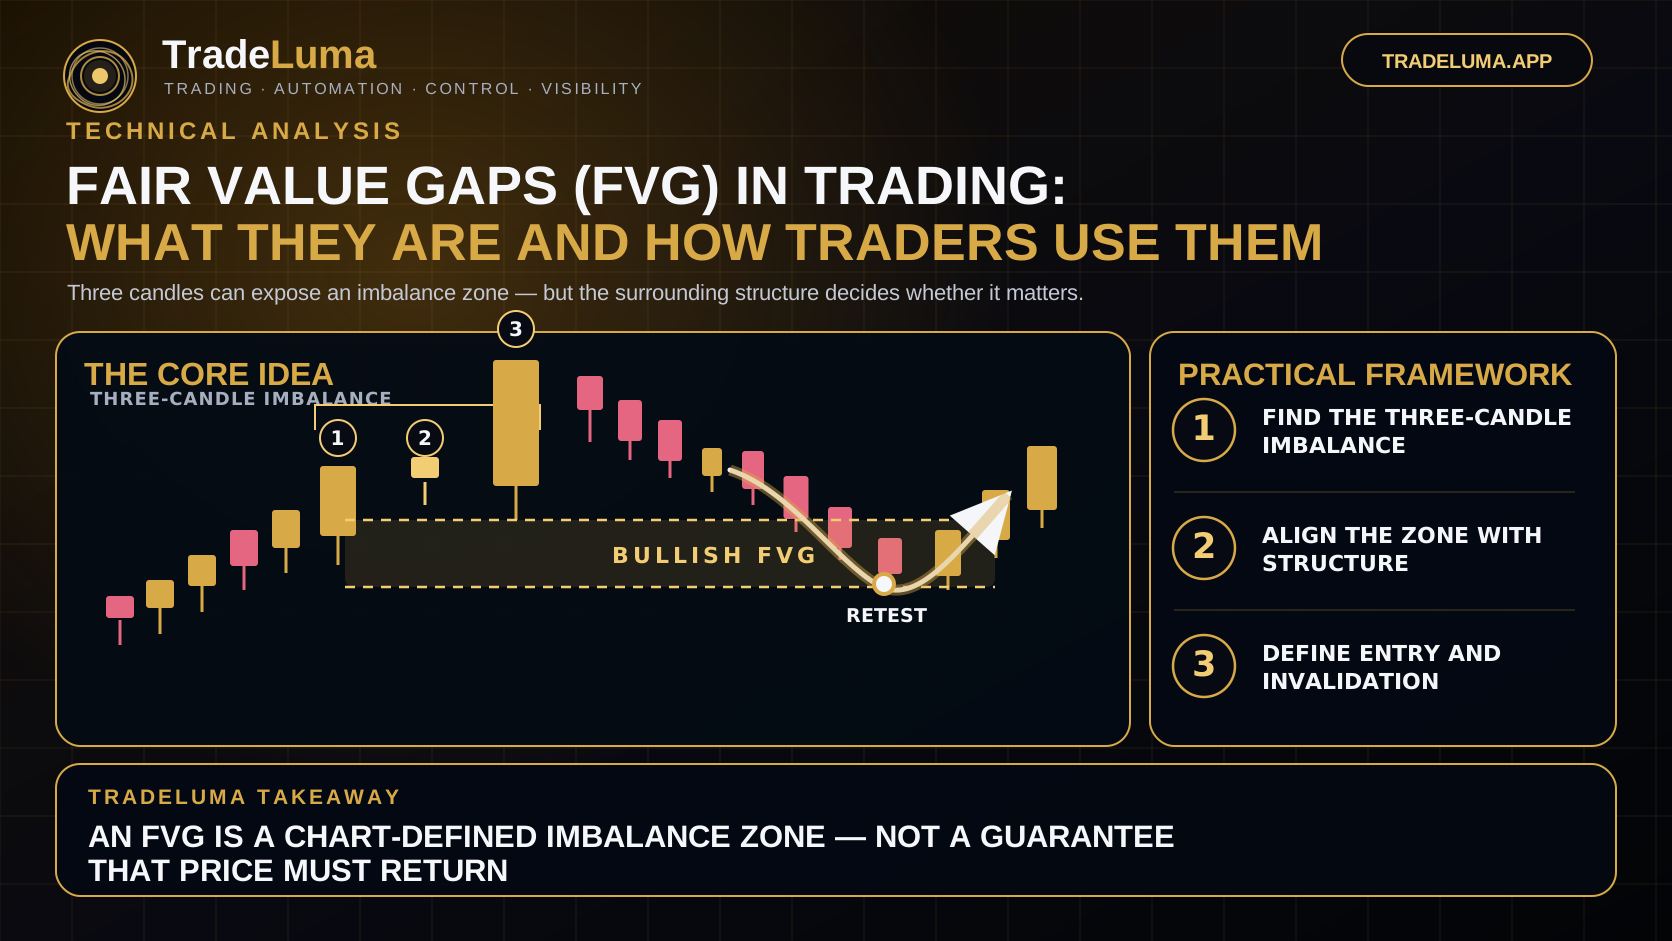
Fair Value Gaps (FVG) in Trading: What They Are and How Traders Use Them
Learn what fair value gaps are, how traders identify bullish and bearish FVGs, and how imbalance zones are combined with structure and risk.
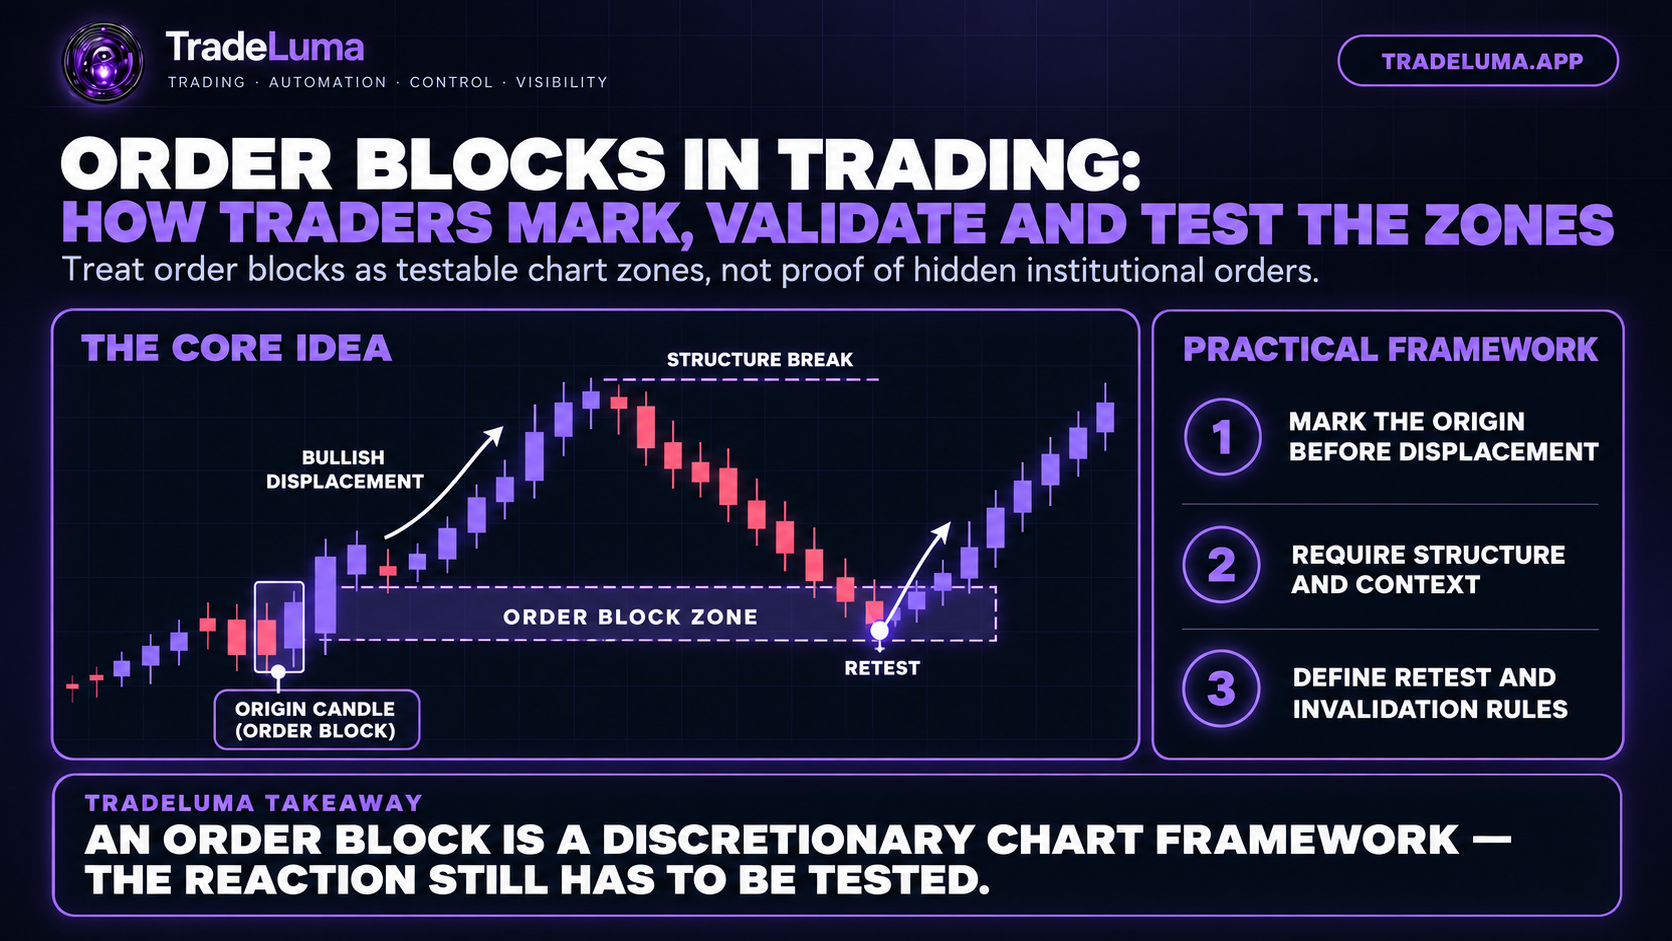
Order Blocks in Trading: How Traders Mark, Validate and Test the Zones
Learn what order blocks mean in technical analysis, how bullish and bearish zones are marked, and how traders test displacement, retests, and invalidation.