
Technical Analysis
Chart Patterns Explained: Triangles, Flags, Double Tops and Head & Shoulders
Learn how common chart patterns are formed, what they may imply about price structure, and how traders define confirmation, invalidation, and targets.
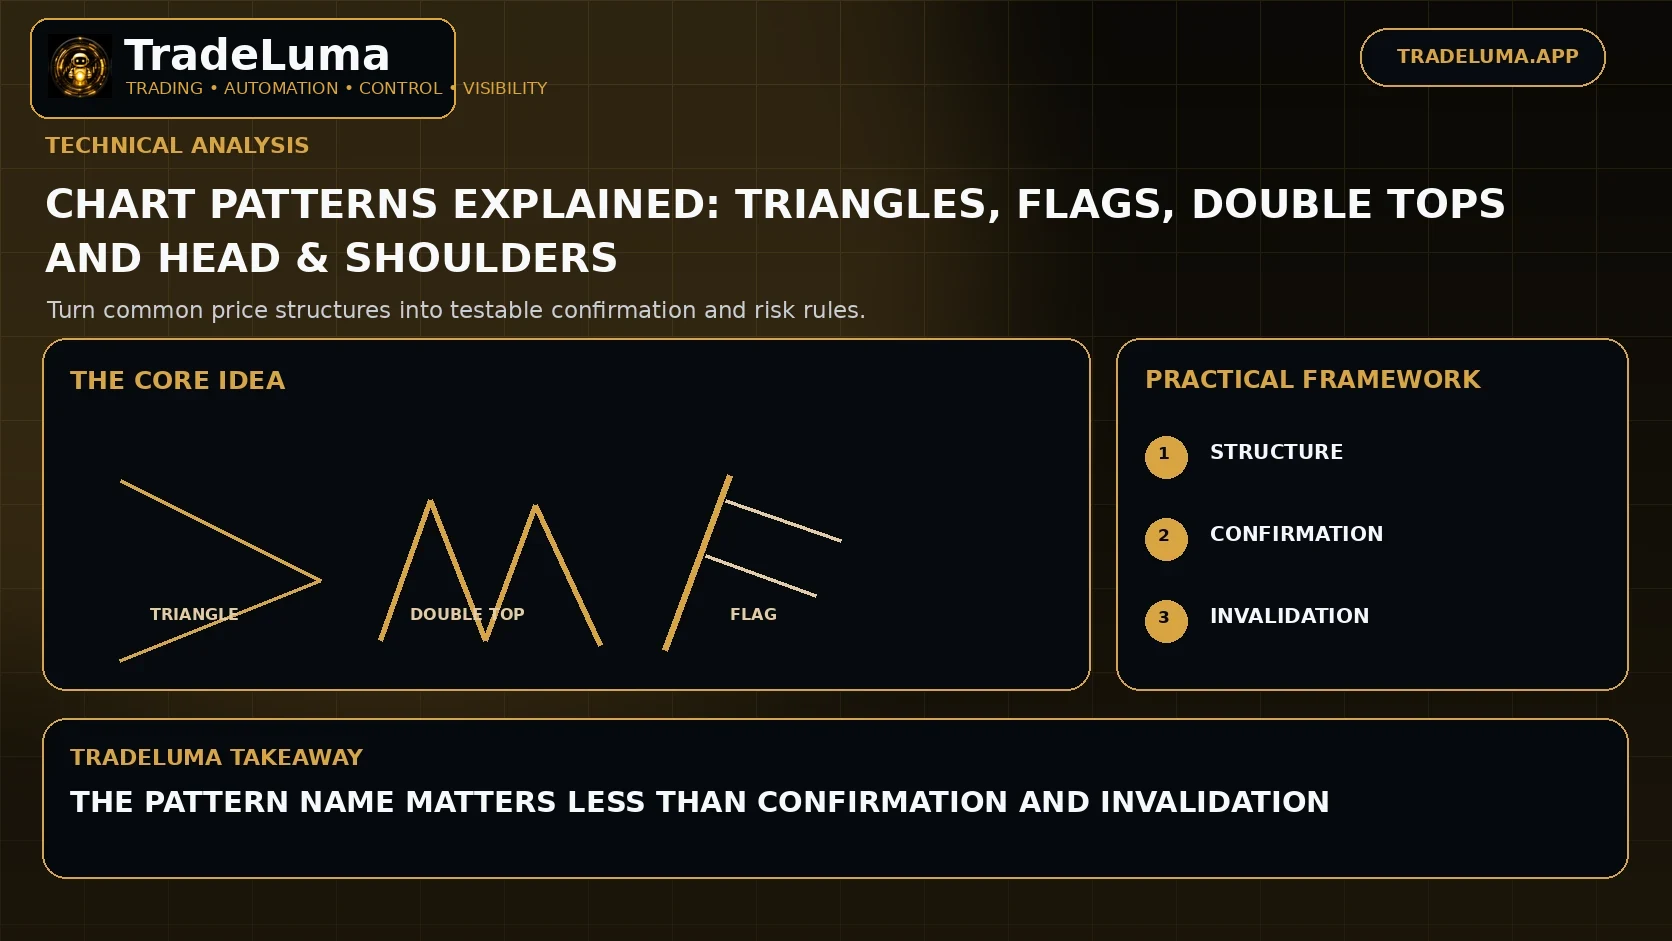
Chart patterns organise repeated price behaviour into recognisable structures such as triangles, flags, double tops, double bottoms, and head-and-shoulders formations. Their value is not in the name itself but in the underlying sequence of contraction, failed continuation, breakout, or trend transition. A useful pattern strategy defines exactly what confirms the setup and where the pattern is invalidated.
Why chart patterns form
Markets alternate between directional expansion and periods of balance or contraction. Repeated buying and selling around visible levels can create shapes that appear across timeframes because similar auction behaviour occurs at different scales.
The same pattern can succeed or fail depending on trend, liquidity, volatility, and nearby structure. Context matters more than memorising a picture.
Triangle patterns
Triangles form when price swings contract. An ascending triangle has relatively flat resistance with rising lows, a descending triangle has relatively flat support with falling highs, and a symmetrical triangle compresses from both sides.
The breakout direction is not guaranteed. A rules-based strategy waits for the chosen confirmation rather than assuming the geometry alone predicts the outcome.
Flags and pennants
Flags and pennants are short consolidations that occur after a strong directional impulse. Traders often view them as potential continuation patterns when the pullback is controlled and the prior move remains structurally intact.
A weak impulse, deep retracement, or prolonged sideways drift can reduce the quality of the continuation idea. Define maximum depth and duration if those features matter to the strategy.
Double tops and double bottoms
A double top forms when price tests a high area twice and fails to continue upward; a double bottom is the opposite. Many traders wait for a break of the intervening swing, sometimes called the neckline, before treating the pattern as confirmed.
The two peaks or troughs rarely match exactly. Treat them as zones and define how much variation is allowed.
Head and shoulders
A head-and-shoulders pattern has three peaks, with the middle peak higher than the two shoulders. The inverse version has three troughs. Traders often focus on the neckline because a break can signal that the prior trend structure has weakened.
Shoulder symmetry is visually appealing but not necessary for every valid setup. Objective rules are more useful than forcing the chart to match a textbook drawing.
Breakout confirmation
Confirmation can require a close beyond the pattern boundary, minimum range expansion, volume increase, volatility expansion, or a retest that holds from the other side. Each additional condition reduces the number of trades and can change entry quality.
The confirmation rule should be chosen before the result is known. Otherwise every successful historical example can be explained differently.
Pattern targets and invalidation
A traditional target often projects the height of the pattern from the breakout point. This is a heuristic, not a promise. Nearby support, resistance, and volatility can make a shorter or trailing target more realistic.
Invalidation typically sits back inside the pattern or beyond the swing that should not be broken after a valid breakout. Position size should follow the distance to that point.
False breakouts
Patterns attract attention, so price can briefly move beyond an obvious boundary and then reverse. False breakouts are especially common when liquidity is thin or the market remains balanced.
Waiting for a close, follow-through, or retest can reduce some false signals but will also create later entries and missed moves. The trade-off should be tested.
How to backtest chart patterns
Convert the visual pattern into measurable rules: number of swing points, maximum depth, slope, duration, breakout condition, stop, and target. Then test across many examples rather than selecting only clean textbook cases.
Review pattern performance by trend direction, volatility regime, timeframe, and instrument. The edge may depend more on context than on the pattern name.
Frequently asked questions
Do chart patterns really work?
Some pattern rules can show useful historical tendencies, but no pattern guarantees an outcome. Their value depends on objective definitions, context, risk management, and testing.
What is a triangle pattern?
A triangle is a period of contracting price swings bounded by converging support and resistance. It can break in either direction.
What confirms a double top?
Many traders wait for price to break the swing low between the two peaks, but the exact confirmation rule should be defined and tested.
Why do chart patterns fail?
They can fail because the market remains balanced, liquidity causes a false breakout, the broader trend overwhelms the setup, or the pattern definition was too subjective.
Continue learning
Related TradeLuma guides
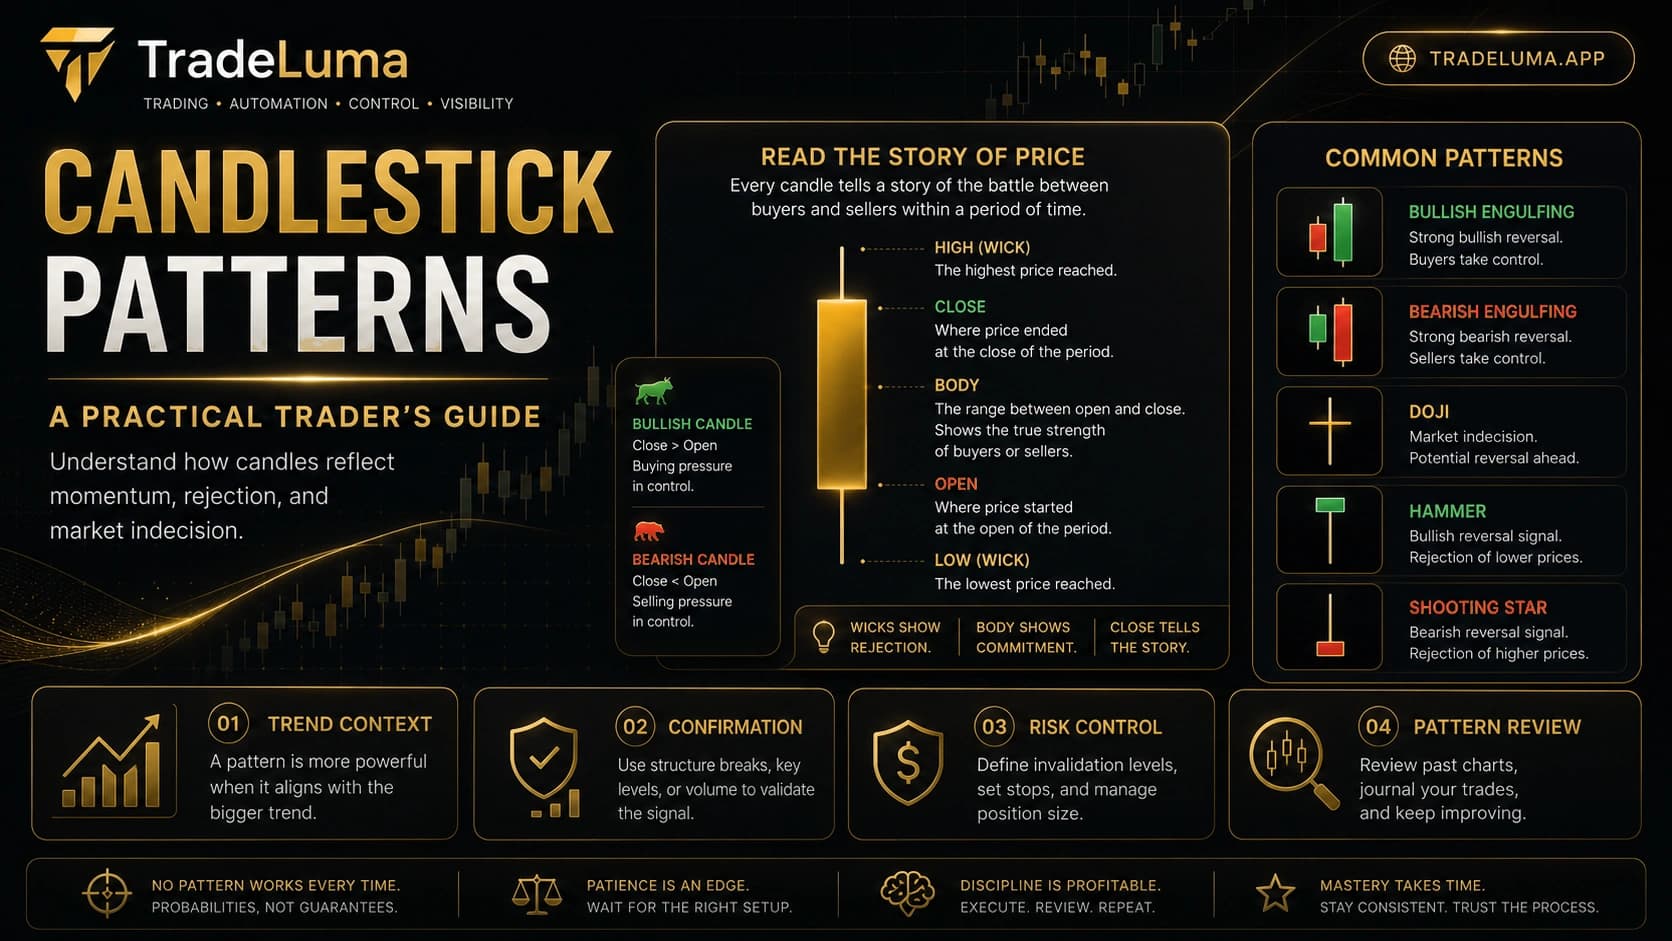
Technical Analysis
Candlestick patterns explained: a practical trading guide
9 Aug 2026 · 12 min read
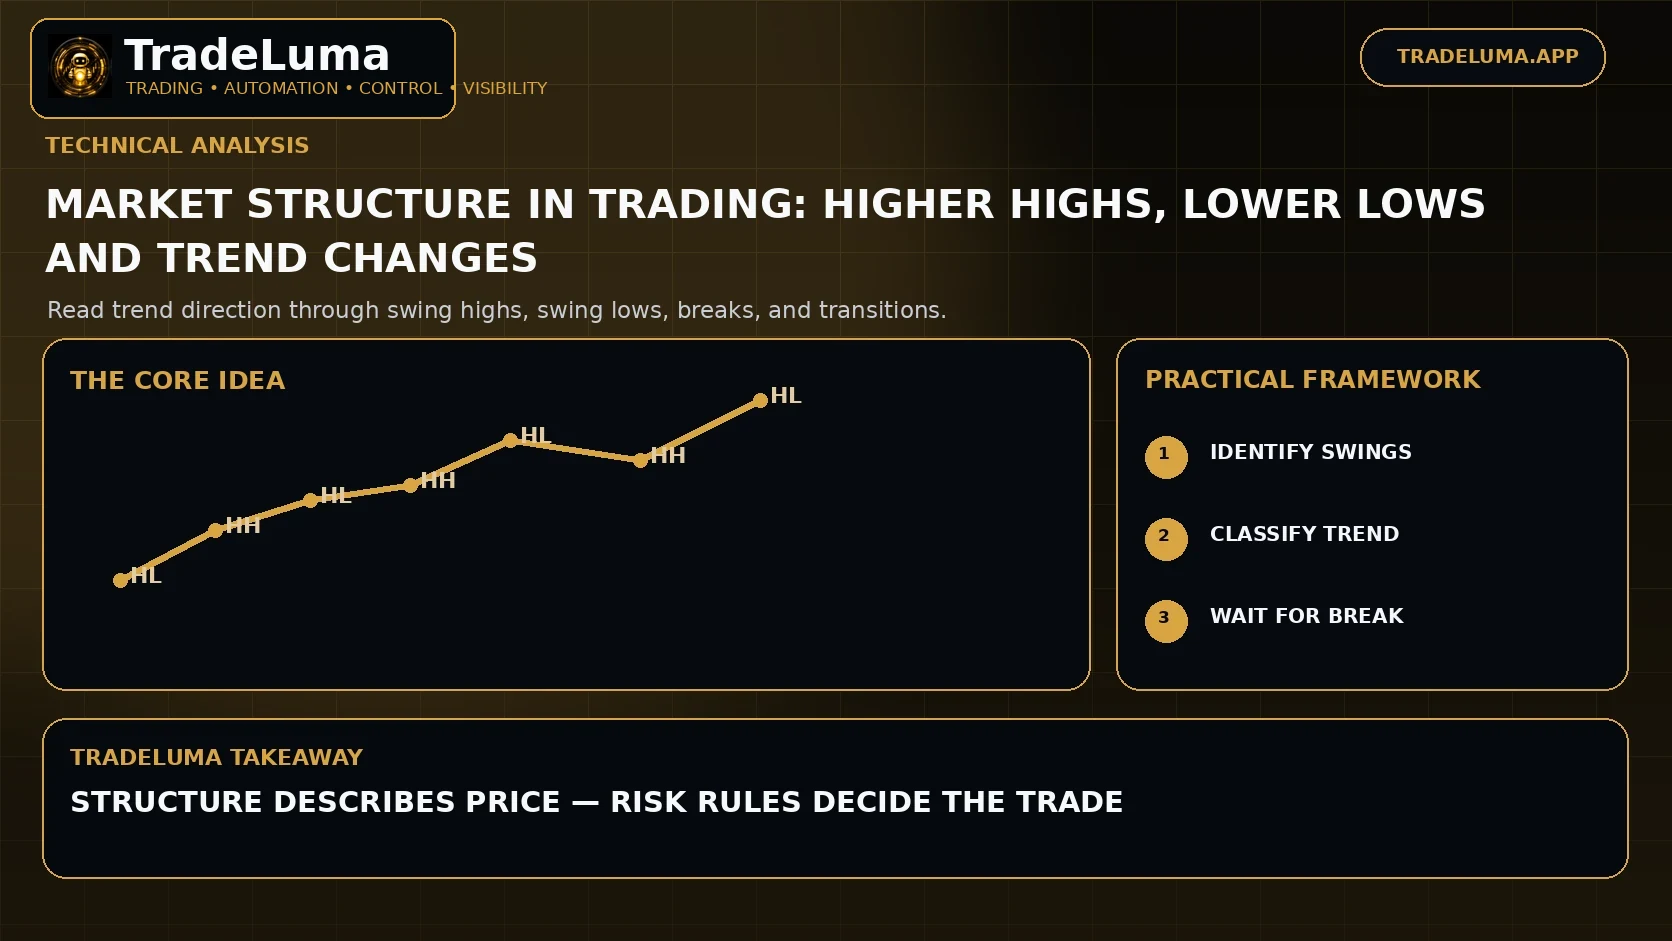
Technical Analysis
Market Structure in Trading: Higher Highs, Lower Lows and Trend Changes
31 Aug 2026 · 11 min read
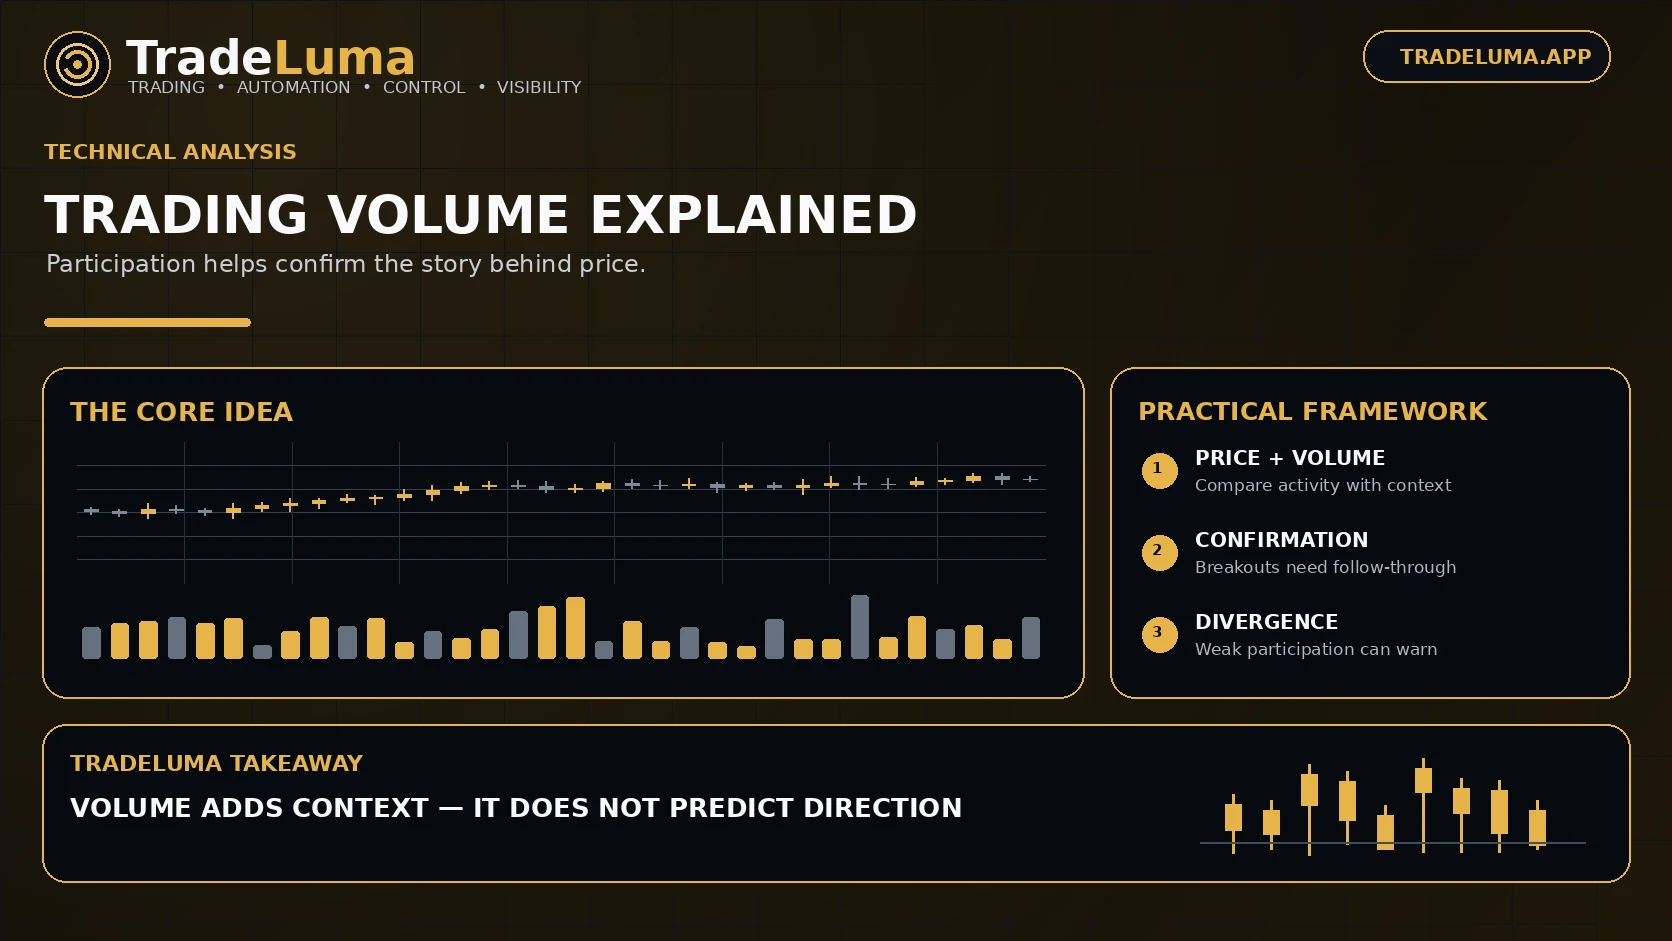
Technical Analysis
Trading Volume Explained: How to Read Volume and Confirm Price Moves
22 Aug 2026 · 11 min read
Build a controlled automation workflow with TradeLuma
Configure alerts, test in paper mode, apply execution controls, and follow broker outcomes from one workspace.