
Technical Analysis
Candlestick patterns explained: a practical trading guide
Understand the basics of candlestick patterns, what candle bodies and wicks mean, and how traders use pattern context, confirmation, and risk control.
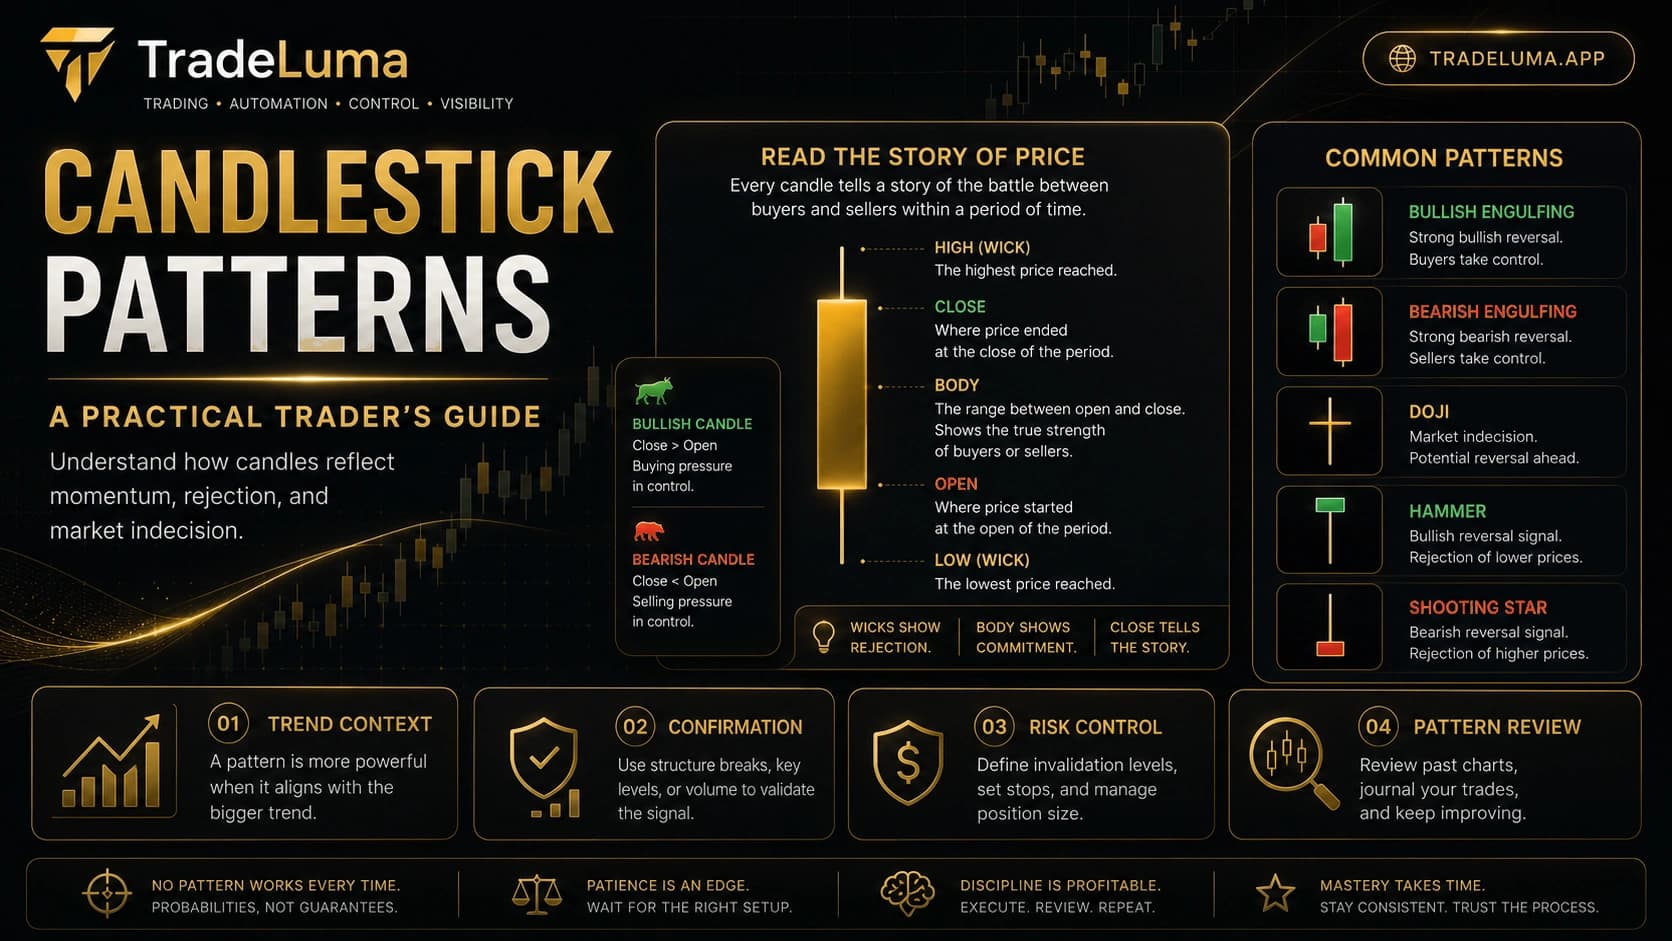
Candlestick patterns remain popular because they turn price movement into something easier to read visually. A single candle shows where price opened, where it closed, and how far it travelled during that period. Several candles together can hint at momentum, rejection, indecision, or a shift in control between buyers and sellers. The real value of candlestick patterns is not memorising names alone, but learning how to read the story price is telling.
What a candlestick shows
Each candlestick represents price movement over a chosen period. The body shows the distance between the opening and closing price, while the wicks show the highest and lowest prices reached during that period. A strong bullish candle often closes near its high, while a strong bearish candle often closes near its low.
This structure makes candles more informative than a single closing price. Traders can see not only where price ended, but also how much conflict, rejection, or momentum occurred during the move.
Why candle shape matters
The size of the body and the length of the wicks provide clues about market behaviour. Large bodies suggest stronger directional conviction, while long wicks may indicate rejection or hesitation. Small bodies often signal indecision, especially when the market tests both directions but finishes without clear control.
These clues are useful because they help traders think beyond up or down. A candle can suggest aggressive buying, weak follow-through, failed breakout attempts, or a pause before continuation.
Common candlestick patterns traders watch
Some of the most widely discussed patterns include bullish engulfing, bearish engulfing, doji, hammer, and shooting star. A bullish engulfing pattern shows a stronger bullish candle fully covering the prior bearish body, suggesting buyers may be taking control. A bearish engulfing pattern shows the reverse.
A doji reflects indecision because open and close are very close together. A hammer often appears after a decline and shows rejection of lower prices through a long lower wick. A shooting star often appears after an advance and shows rejection of higher prices through a long upper wick.
Context matters more than memorisation
A candlestick pattern has more meaning when it appears in a logical place. A hammer near support may be more interesting than a hammer in the middle of a random range. A bearish engulfing pattern near resistance may carry more weight than the same pattern inside a strong uptrend with no nearby structural reason for reversal.
This is why experienced traders rarely trade a pattern in isolation. They consider trend direction, support or resistance, session timing, and whether the market has already extended too far from structure.
Look for confirmation before acting
Confirmation can come from the next candle, a break of a recent high or low, a volume surge, or a reaction at a key price area. The purpose of confirmation is not to remove all uncertainty. It is to reduce the chance of acting on a pattern that looked important but had little follow-through.
For example, a doji by itself only shows indecision. The next move helps explain whether the pause resolved higher, lower, or not at all. Waiting for confirmation can reduce false entries even if it sometimes means entering slightly later.
Risk control still matters
Candlestick patterns can improve timing, but they do not remove the need for risk control. Traders still need invalidation levels, position sizing, and realistic target planning. A good-looking pattern can fail quickly, especially during news events or low-liquidity conditions.
This is why patterns should fit inside a larger trading plan. The question is not only whether the setup is attractive, but also whether the potential reward justifies the risk if the idea is wrong.
Use review to find which patterns suit your process
Not every trader needs to use every candlestick pattern. Review and journaling can show which setups are most understandable and repeatable within a specific strategy. Some traders may find engulfing patterns useful, while others may prefer breakout continuation candles or rejection candles near levels.
The review process can also show where pattern reading becomes too subjective. If a pattern can only be identified after the trade is finished, it may not be useful enough for live decision-making.
Candlestick patterns are a language, not a shortcut
Candlestick patterns are helpful because they provide a visual language for describing market behaviour. They help traders recognise momentum, hesitation, and rejection more quickly. But they are not shortcuts that replace planning, context, and discipline.
The strongest use of candlestick analysis is to support structured decision-making. Read the story of price, wait for confirmation, manage the risk, and judge the trade by the quality of the process rather than the pattern name alone.
Frequently asked questions
What do candlestick wicks mean?
Wicks show the highest and lowest prices reached during the period. Long wicks often suggest rejection or strong two-way activity.
What is a bullish engulfing pattern?
A bullish engulfing pattern occurs when a larger bullish candle fully covers the previous bearish candle body, suggesting buyers may be taking control.
Is a doji bullish or bearish?
A doji is not bullish or bearish by itself. It usually signals indecision, and the surrounding context plus the next candles help determine its meaning.
Do candlestick patterns work on their own?
They are usually more reliable when combined with context such as trend, support or resistance, and confirmation rather than used as standalone signals.
Continue learning
Related TradeLuma guides
Technical Analysis
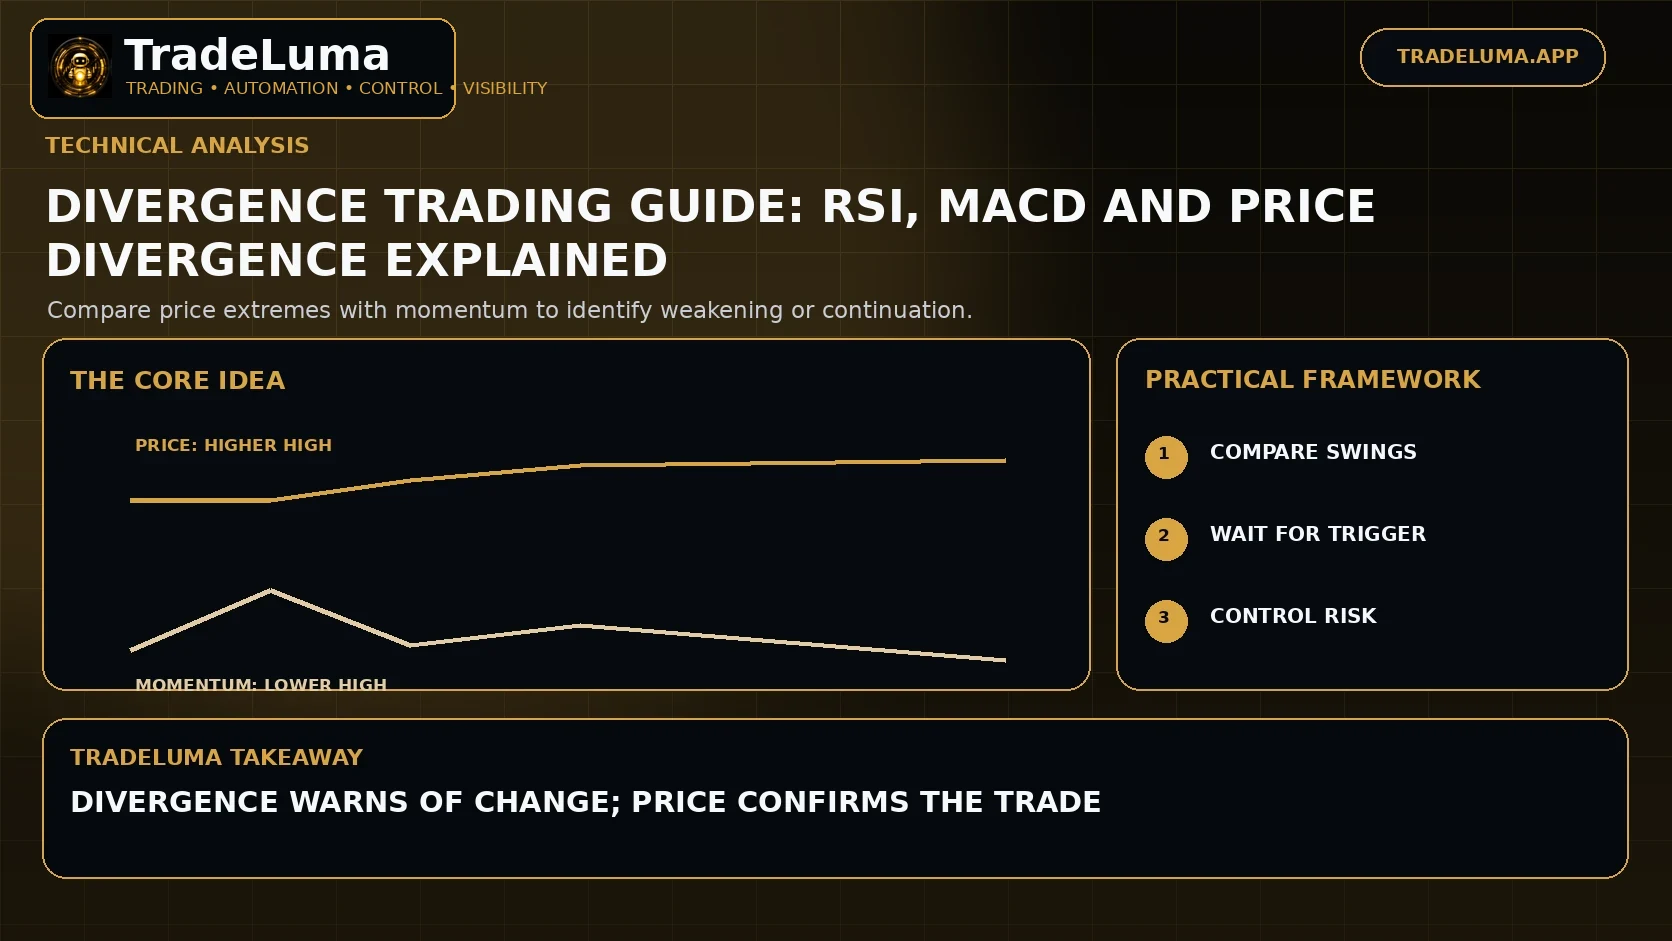
Divergence Trading Guide: RSI, MACD and Price Divergence Explained
12 Sept 2026 · 11 min read
Technical Analysis
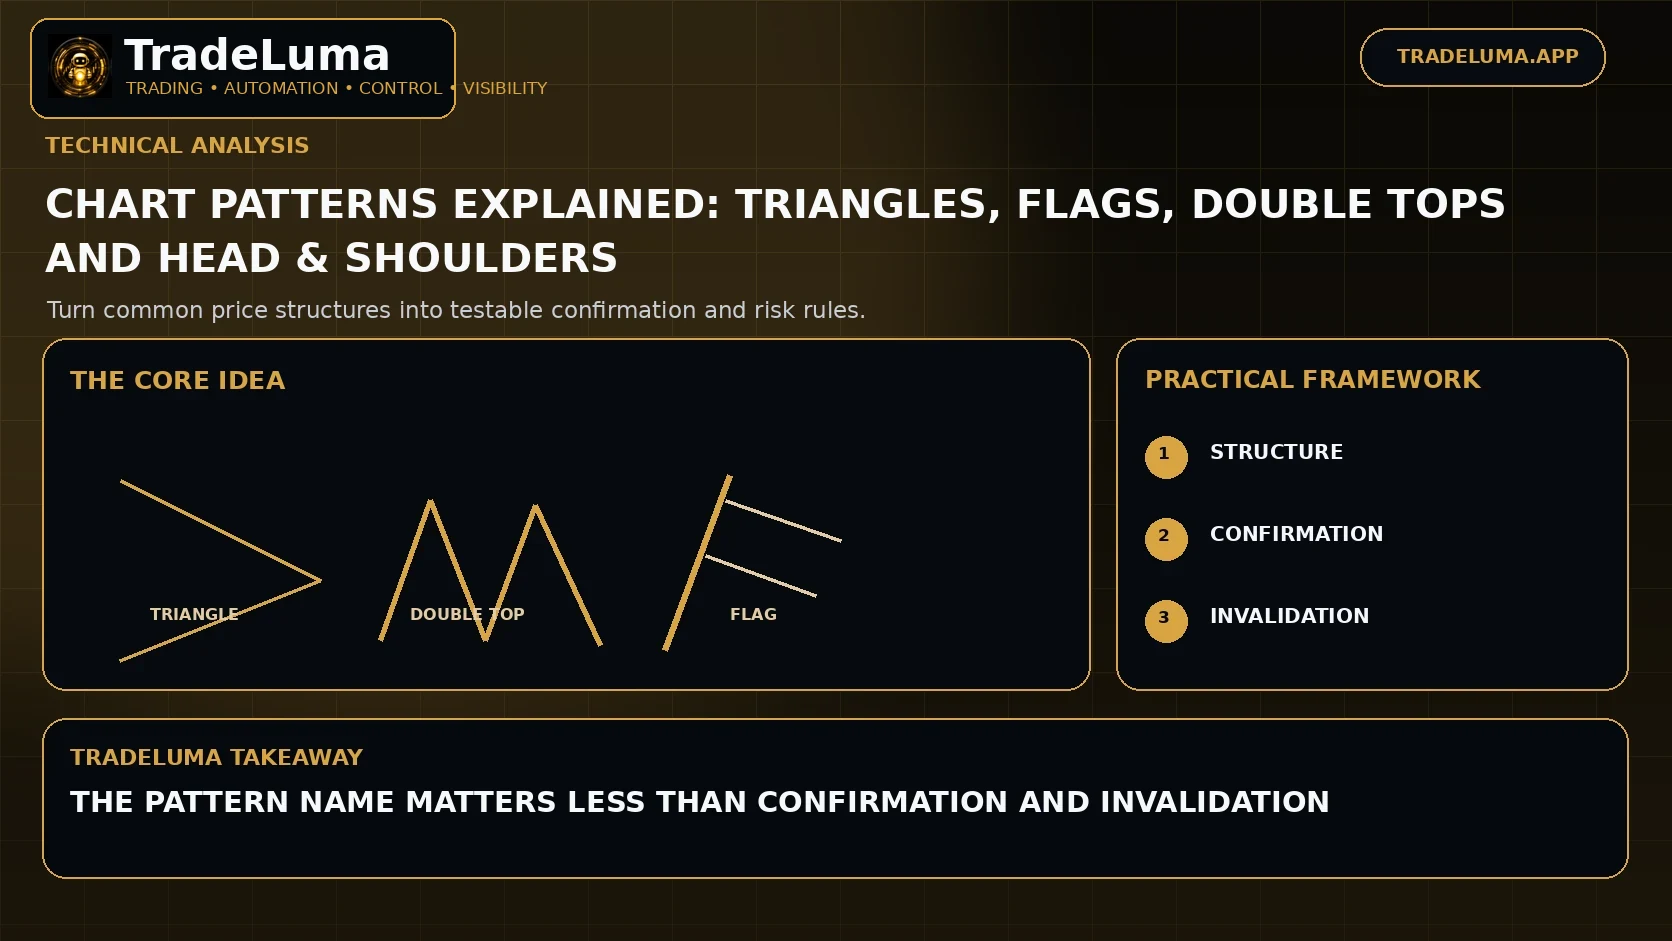
Chart Patterns Explained: Triangles, Flags, Double Tops and Head & Shoulders
6 Sept 2026 · 13 min read
Technical Analysis
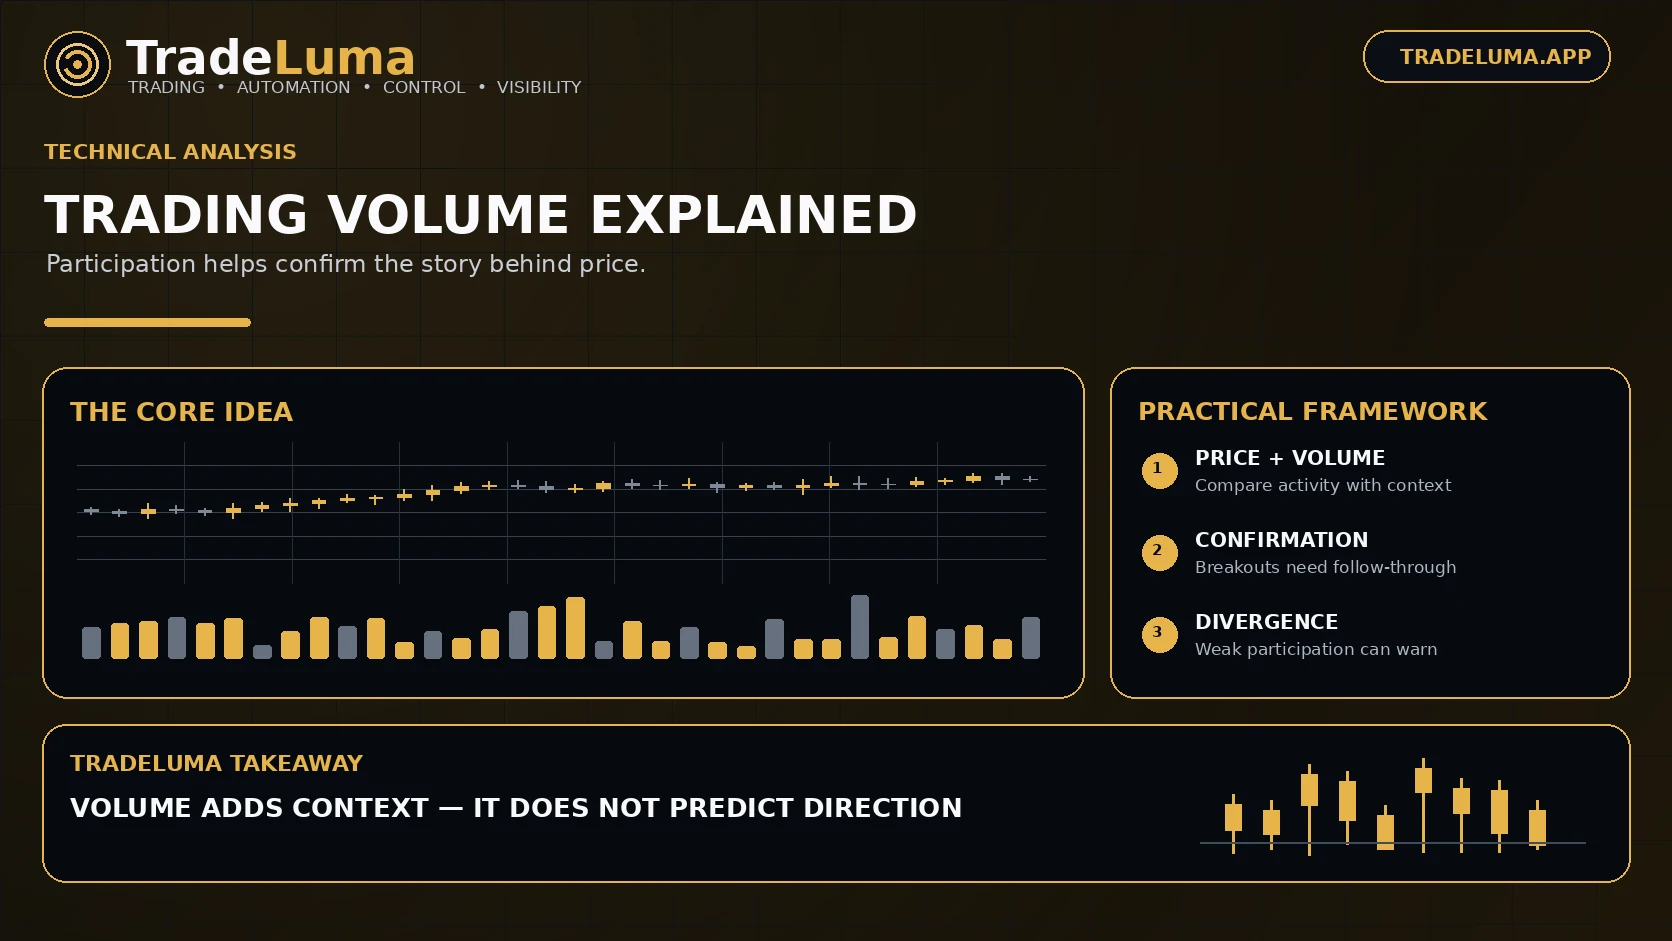
Trading Volume Explained: How to Read Volume and Confirm Price Moves
22 Aug 2026 · 11 min read
Build a controlled automation workflow with TradeLuma
Configure alerts, test in paper mode, apply execution controls, and follow broker outcomes from one workspace.