
Macro & Markets
ISM Services PMI October 2026: Why 54.5 Growth and 73.0 Prices Matter for Gold and Nasdaq
October 2026 ISM Services PMI was 54.5 with prices at 73.0. Learn why services growth, inflation and Fed expectations matter for gold, Nasdaq and Treasury yields.
On this page+

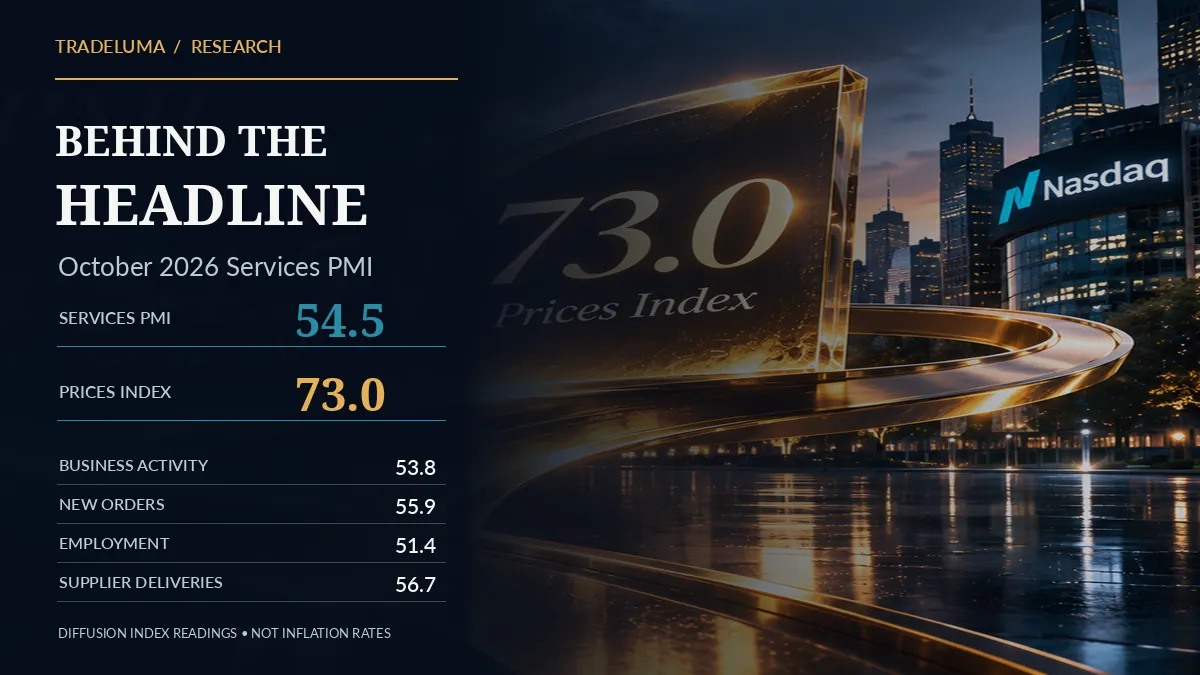
The October 2026 US ISM Services PMI, released on November 4, showed the service economy still expanding, but at a slightly slower pace. The headline index eased to 54.5 from 54.9 in September, while the Prices Index remained elevated at 73.0. New Orders slowed to 55.9 and Employment improved to 51.4. That combination is important for traders because economic activity, hiring and price pressure can point in different directions. This guide explains what each number really means, how the information may shift Federal Reserve expectations and why gold, the dollar, Treasury yields and Nasdaq futures do not always respond the way a simple stronger-or-weaker headline might suggest.
The 4 November ISM Services PMI release: key October 2026 numbers
The Institute for Supply Management released its October Services PMI report at 10:00 a.m. US Eastern time on Wednesday, November 4, 2026. The headline came in at 54.5 compared with 54.9 in September. ISM described that as the 28th consecutive month in expansion territory. The headline was lower month on month, but remained comfortably above the neutral 50 threshold.
The detail tells a more interesting story. Business Activity was 53.8, down from 56.5; New Orders were 55.9, down from 59.8; and the Employment Index rose to 51.4 from 50.1. The Prices Index eased to 73.0 from 74.0 but remained high. Slower reported new-order growth alongside widespread price increases can be more relevant to rate-sensitive assets than the headline number alone.
What does a Services PMI reading of 54.5 actually mean?
PMI stands for Purchasing Managers' Index. ISM surveys purchasing and supply-management executives about whether business conditions improved, were unchanged or deteriorated compared with the prior month. A diffusion index is constructed from those responses. Broadly, above 50 indicates an increase or expansion, below 50 indicates a decline or contraction, and 50 is roughly unchanged.
The number 54.5 is not a prediction that the service sector grew 54.5%, nor does the move from 54.9 to 54.5 mean services output fell 0.4%. It describes the breadth and direction of reported changes. It also is not a direct measure of GDP or a consumer-price inflation rate. That distinction matters whenever headlines describe PMI data as 'growth' or 'inflation'.
Why the Prices Index at 73.0 drew attention
The October Services Prices Index was 73.0, down slightly from September's 74.0. It remained above 70 for the seventh time in eight months, according to ISM. A reading this high suggests price increases were widespread among responding businesses. It does not mean business prices or consumer inflation rose by 73%.
Services prices can reflect labour expenses, insurance, transportation, energy, supply chains and other operating costs. The index does not directly identify how much of those costs businesses can pass on to customers. For Federal Reserve analysis, persistent pricing pressure raises questions about the pace of disinflation, but the CPI, PCE and wage data are needed to evaluate the actual inflation trend.
New Orders 55.9 and Business Activity 53.8: still positive, less forceful
New Orders declined by 3.9 percentage points to 55.9, while Business Activity declined by 2.7 points to 53.8. Both indices remained above 50, meaning more respondents reported increases than decreases under the survey's calculation. They nonetheless suggested that momentum was less broad than in September.
Separating activity, orders and prices prevents overreading the headline. Businesses can still be expanding and placing new orders while reporting high input-price pressure. Such combinations can make the trade-off between inflation risk and growth sensitivity harder for policymakers and investors to interpret.
Employment 51.4: why the labour component matters
The Services Employment Index increased to 51.4 from September's 50.1. It remained above 50 for a second consecutive month. This is a directional purchasing-managers survey, not an estimate of how many payroll jobs the economy added.
JOLTS, ADP, nonfarm payrolls and initial jobless claims answer different employment questions. The November 3 JOLTS release measures vacancies and worker flows; ISM's employment component reflects whether surveyed service firms report increased or decreased employment conditions. Reading them together is more useful than treating either one as a full labour-market census.
Supplier Deliveries at 56.7: the easily missed inversion
ISM's Supplier Deliveries Index rose to 56.7 from 53.2. Unlike most PMI components, a reading above 50 means deliveries are slowing. Longer delivery times can occur because demand is strong, but may also reflect capacity limits, transport disruptions or procurement bottlenecks.
A slower-deliveries reading can lift the composite Services PMI without representing stronger final demand. In periods of supply stress, traders should look at New Orders and Business Activity separately rather than interpreting a higher composite number as uniformly bullish.
How ISM Services PMI changes Federal Reserve rate expectations
The Federal Reserve weighs price stability alongside employment conditions. A services report showing resilient activity and sticky pricing pressure may reduce confidence that inflation will return to target quickly, particularly when reinforced by other inflation indicators. This can sometimes lead traders to price a higher expected path for policy rates or fewer rate cuts.
A weaker activity reading can simultaneously raise concern about growth, which may support expectations of easier policy. The net reaction depends on which part of the report surprises investors, what the market had already priced and how upcoming PCE, CPI, payroll and wage releases compare. ISM by itself does not determine a Fed decision.

Why gold may rise or fall after a PMI surprise
Gold earns no coupon, so changes in inflation-adjusted bond yields can influence its opportunity cost. If PMI details push real yields and the US dollar upward, gold may face pressure. If they reduce expected rates and weaken the dollar, gold may benefit, other things equal.
The qualification is crucial. A report that raises inflation fears can also lift demand for perceived hedges, while a broad risk-off response can move gold and the dollar in the same direction. Gold futures positioning, central-bank demand and geopolitical risk may overpower a short-term rates interpretation.
Why Nasdaq futures can react differently from gold
Long-duration growth equities are sensitive to discount rates. Higher expected real yields can weigh on the present value of future earnings, potentially creating pressure on Nasdaq-100 valuations. But resilient service demand can also support revenue expectations, and a softer report may be interpreted positively if investors think rate cuts become more likely.
The same weaker data can be negative if it signals a material slowdown in business spending. This is why traders should distinguish a 'growth scare' from a 'rate relief' reaction instead of assuming that softer PMI automatically means higher Nasdaq futures.
Services PMI versus Manufacturing PMI: why both reports matter
ISM surveys manufacturing and services separately. The US services economy covers industries such as finance, healthcare, retail, accommodation, professional services and transport, while manufacturing focuses on production activities. Their surveys and sector weights are not interchangeable.
A headline surprise in one sector can coexist with a different trend in the other. Read both reports, especially New Orders, Employment and Prices. The level relative to 50 is useful, but momentum, industry breadth and revisions to expectations are what traders often use to form an economic narrative.
What markets actually trade: expectations, not the headline alone
An economic release can appear strong in absolute terms while disappointing an optimistic consensus, or appear soft while exceeding a pessimistic one. The immediate market reaction reflects the gap between released information and expectations embedded in assets, plus positioning and liquidity.
Before interpreting a move, compare the actual result with the consensus forecast available before 10:00 a.m. Eastern time, then assess the subindices and US Treasury yield response. Avoid assigning a single cause to every intraday swing when election results, corporate earnings or geopolitical headlines are also affecting prices.
A practical PMI trading checklist for gold and Nasdaq
Before the announcement, record the release time, consensus headline, prior reading, important subindex estimates when available, and the current direction of 2-year and 10-year yields, real yields and the US dollar. Decide whether the main risk is a rates surprise, an inflation surprise or a growth surprise. Do not invent a forecast after seeing the data.
After the report, read Prices, New Orders, Employment, Business Activity and Supplier Deliveries before deciding what story the market is pricing. Watch for temporary spread widening, false breakouts and reversals during the first minutes. If an automated system is used, define order-entry expiry, exposure caps and loss limits before the event rather than adjusting them in reaction to one headline.
What October's combination of slower activity and sticky prices does not prove
An elevated Prices Index does not establish an inflation rate or prove that the US economy is entering stagflation. Likewise, a modest decline in the composite PMI does not establish a recession. The report is a sample-based directional survey; the underlying economic data, trends and policy transmission mechanisms require broader evidence.
The responsible conclusion from the November 4 release is narrower: services activity was still expanding, some growth measures moderated and price increases remained widely reported. Whether that changes gold or Nasdaq trends depends on the subsequent flow of economic information and investor expectations.
Frequently asked questions
What was the ISM Services PMI for October 2026?+
The October 2026 US ISM Services PMI was 54.5, compared with 54.9 in September. ISM released the October report on November 4, 2026.
What does a Services PMI reading above 50 mean?+
Generally, it means conditions are increasing or expanding under the diffusion-index survey. It does not mean GDP or services output grew by 50%.
Why was the October 2026 ISM Prices Index important?+
The Prices Index was 73.0, showing a broad prevalence of reported increases in prices paid by services businesses. It is not an annual or monthly 73% inflation rate.
Does a high Services PMI make gold fall?+
Not automatically. Higher expected real yields and dollar strength can weigh on gold, but inflation worries, safe-haven demand, positioning and other drivers can produce a different outcome.
Is ISM Services PMI good or bad for Nasdaq?+
It depends on whether investors focus on earnings support from resilient growth or valuation pressure from higher yields, and on whether the report beats or misses expectations.
When was the October 2026 ISM Services PMI released?+
Wednesday, November 4, 2026, at 10:00 a.m. US Eastern time.
Why did supplier deliveries of 56.7 matter?+
For ISM Supplier Deliveries, readings above 50 indicate slower delivery times. This is the inverse of the usual interpretation for activity and orders.
What is the difference between ISM Services PMI and JOLTS?+
ISM Services PMI is a monthly purchasing-managers survey covering services conditions; JOLTS estimates job openings, hires and separations. They measure different aspects of the US economy.
Futures workflows
Explore the strategy side of TradeLuma.
Browse TradeLuma's futures strategy catalogue and the chart, rollover, and reference methodology used for each published strategy.
Explore futures strategies →Continue learning
Related guides.

US CPI November 2026 Preview: Why October's Annual Inflation Data Are Missing—and What Gold and Nasdaq Traders Should Watch
US October 2026 CPI arrives 10 November. Learn why most annual CPI rates will be unavailable, what monthly inflation shows, and the implications for gold, Nasdaq and Fed rates.

US Jobs Report October 2026: Why 165,000 Payrolls Moved Gold, Nasdaq and Fed Expectations
October 2026 nonfarm payrolls rose 165K, unemployment fell to 4.1% and wages grew 0.4%. Understand the November 6 jobs report and its effects on gold and Nasdaq.

Bank of England Raises Rates to 4% in November 2026: Why GBP, Gold and Markets Care
The Bank of England raised Bank Rate to 4% on 5 November 2026. Explore its 8–1 vote, UK inflation outlook, GBP/USD, gilts and implications for gold and Nasdaq.