
Gold & Macro Markets
Gold Below $4,000: Why XAU/USD Is Falling and the Next Levels Traders Are Watching
Gold fell below $4,000 on November 12, 2026 as a stronger dollar and Fed hike bets pressured XAU/USD. Explore price levels, PPI risks and MGC futures.
On this page+

Gold's move below US$4,000 per troy ounce has become one of the week's defining market stories. On Thursday, November 12, 2026, Reuters reported spot bullion around US$3,932 in a later-session snapshot, down approximately 1.4% on the day, with December US gold futures near US$3,937. Earlier in Asian trading the same day, spot gold was nearer US$3,978: these are different observations, not conflicting closing prices. A hotter-than-expected US inflation release, a firmer dollar and a rapid reassessment of December Federal Reserve policy explain much of the pressure. But a broken round number is not, by itself, a trading signal. This guide separates the evidence from the speculation, maps the scenarios surrounding $4,000 and considers what the shift means for XAU/USD, COMEX gold and Micro Gold futures.
What happened to gold on November 12, 2026?
Gold extended its slide for a third session on Thursday. In a report published earlier in the Asian day, Reuters placed spot gold at approximately US$3,977.99 per ounce by 05:06 GMT, with December gold futures near US$3,983.20. A later Reuters update described spot gold around US$3,931.54, down 1.4%, and US December futures at US$3,936.80. These figures are snapshots at different times and should never be represented as one official daily close.
The sell-off took the metal to its lowest level since November 4 and back through the psychologically important US$4,000 area. After a strong run in prior months, such a move can attract attention from discretionary traders, trend-following strategies and option hedgers. However, a one-day decline of roughly 1.4% is not evidence of an exchange malfunction or a market-wide flash crash. Describing it accurately matters when readers search for a “gold price crash.”
Why hotter US inflation sent bullion lower
The catalyst began on Tuesday, November 10, with the release of October US consumer price data. Headline CPI increased 0.4% on the month against market expectations of 0.3%. Core CPI, which excludes food and energy, rose 0.3% against a 0.2% forecast. The discrepancy was numerically small but highly relevant for investors positioning for how the Federal Reserve might react.
Gold is often labelled an inflation hedge. That description can be helpful for some long-term portfolios but is incomplete for short-term pricing. If investors expect the central bank to respond to inflation by raising rates, the expected return on interest-bearing assets rises. Gold pays no coupon or dividend. A hotter inflation reading can therefore make the opportunity cost of holding bullion higher even as investors remain concerned about inflation itself.
The stronger dollar is the second part of the gold sell-off
Reuters reported the dollar climbing to a 19-month high against major currencies on November 12. Gold is normally priced internationally in US dollars, so a stronger dollar raises its price for many non-US buyers before any adjustment in the bullion quote. That can restrain demand at the margin and encourage leveraged traders to reduce positions.
The dollar/gold relationship is a tendency, not a mathematical law. During some episodes of global stress, the dollar and gold can rise together as investors seek liquidity and protection simultaneously. Traders should assess the dollar index, Treasury yields and gold price action together rather than applying a simplistic rule that a strong dollar always requires a short-gold trade.
How December Federal Reserve expectations changed
Before the inflation surprise, investors had been debating whether the Fed would need to tighten further. The report and hawkish commentary led markets to price at least a quarter-point December increase much more aggressively. In a November 12 Reuters snapshot, futures reflected approximately an 89% probability of a 25-basis-point increase and an 11% probability of a 50-basis-point move. Those numbers are time-specific market-implied probabilities, not promises about what the Fed will do.
The Federal Reserve is scheduled to meet December 8–9, 2026. Its decision will depend on incoming activity, inflation and employment information, and it will be made by the committee rather than by a single official. Treating a possible 50-basis-point increase as already confirmed would be a mistake.
Why Treasury yields matter more than the headline price of gold
Bond yields help translate policy expectations into the relative attractiveness of different assets. A higher nominal Treasury yield increases the return available on a security that pays interest; changes in inflation expectations influence the inflation-adjusted, or real, yield. Real yields often matter especially for the relative appeal of a non-yielding asset like gold.
On November 10, the US 10-year yield briefly exceeded 5% intraday according to contemporaneous market reporting, but that does not mean it finished the day above 5%. The two-year yield reacted strongly to the near-term policy repricing. For gold, watch whether yields continue climbing and whether the move is driven by real rates, inflation compensation or a mix of both. The distinction can change the interpretation.
Is $4,000 broken support or a potential reclaim level?
Round-number prices attract attention because many participants notice them at the same time. US$4,000 can become an area of concentrated orders, stops, options activity and discretionary decisions, but a line drawn at an exact dollar is not a scientifically established support level.
There are two broad possibilities. Continued acceptance below $4,000—especially during active US sessions with a firm dollar and elevated yields—would support the case that sellers remain in control. A sustained recovery above $4,000 followed by successful retests could instead suggest that the initial breakdown failed. Traders should define the timeframe, required confirmation and invalidation before treating either move as actionable.
The next zones on a gold trader’s watchlist
The first reference is US$4,000 itself. Below it, the recent US$3,930 area is relevant because of the November 12 Reuters price observation, not because it is a guaranteed price floor. The wider US$3,900 region is a psychological zone worth monitoring if the decline continues. Above $4,000, the US$4,030–$4,070 area roughly corresponds to recently observed market activity and can be monitored for a failed rally or improving acceptance.
These are illustrative reference areas, not verified order-book clusters or guaranteed pivot calculations. A precise intraday entry requires up-to-date contract-specific charts, liquidity and the trader’s own tested method. Spot XAU/USD and COMEX GC or MGC contracts will not always print identical prices.
Bullish scenario: gold reclaims the lost round number
A bullish recovery scenario would require gold to move back through $4,000 and hold above it on a chosen confirmation timeframe. More constructive price action might coincide with a softer US dollar, stabilising real yields or evidence that the next inflation data does not add to the hawkish Fed narrative. A rally accompanied by broad participation is more convincing than a momentary spike through the round number.
Even under that scenario, a rebound after a steep decline can be short covering rather than the start of a lasting uptrend. One sensible research question is whether price can form higher lows after reclaiming the level. The scenario fails if the attempted recovery quickly loses $4,000 again and sellers regain control.
Bearish scenario: the breakdown becomes accepted
A bearish continuation scenario would be consistent with gold staying below $4,000, lower rebounds, and a dollar and yield environment that remains restrictive. Additional hotter-than-expected US producer inflation or hawkish central-bank commentary might reinforce that pressure, although any single release can move more than one market at once.
The practical danger is chasing a move once volatility has expanded and liquidity has thinned. A late short entry can have poor reward-to-risk even if the broader view remains bearish. Traders should distinguish their trend thesis from the price they are willing to pay for it and identify a clear level at which their setup is no longer valid.
Range scenario: why a dramatic headline may produce no clean trade
Gold can also oscillate around a major round number without starting a sustained trend. After a macro shock, active sellers may take profit while bargain hunters and hedgers test the market. Repeated whipsaws near $4,000 can create substantial transaction costs for high-frequency entry rules even when a longer-term chart appears simple.
In a range scenario, a system that waits for clean confirmation or stands aside may behave more consistently than one that treats every crossing as a breakout. Traders should review the performance of their own strategies in high-volatility sideways markets, particularly around economic releases.
Friday November 13: US producer inflation is the next test
The US Producer Price Index report scheduled for Friday, November 13 is a natural next catalyst because it offers another view of price pressures upstream of consumer prices. Markets may react not only to the headline but also to core components, revisions and how the data changes the expected policy path.
As of the publication date, the November 13 result has not been released. This article does not predict a PPI number or state what gold will do after it. Release schedules and market expectations can shift; confirm them with the relevant official calendar before entering an event-sensitive position.
Spot XAU/USD versus GC and MGC futures: do not mix the quotes
Spot gold and COMEX futures are related but distinct instruments. Spot XAU/USD is quoted as a price per troy ounce for immediate or near-term bullion delivery conventions, while a gold futures contract specifies a future delivery month and is marked under exchange rules. The difference between their prices can reflect financing, storage, contract maturity and temporary trading conditions.
For the widely traded standard COMEX Gold contract (GC), contract size is 100 troy ounces. For Micro Gold (MGC), contract size is 10 troy ounces—one tenth of GC. Both contracts use a minimum price increment of US$0.10 per ounce. Therefore one MGC tick is US$1 per contract and one GC tick is US$10 per contract. These are exchange contract mechanics, not broker-specific commissions or margin requirements.
What a $50 gold move means for Micro Gold futures
One MGC contract represents 10 ounces. If gold futures move by $50 per ounce, the gross mark-to-market change for one Micro Gold contract is $500; for two contracts it is $1,000. A $10 movement represents $100 per MGC contract. A move against the position has the same magnitude as a move in its favour, before fees, spreads, slippage and any financing or broker charges.
A contract with a notional value around $40,000 when gold is near $4,000 per ounce is not the same as paying $40,000 in cash to open a position. Futures use margin, so small percentage moves in the underlying can translate into large changes relative to posted collateral. Margin can rise during stress, and losses can exceed the amount initially deposited. This is why position size should start with the maximum acceptable dollar loss, not simply the number of contracts a broker permits.
How a risk-controlled gold strategy handles a macro shock
An automated or discretionary gold strategy should define which market data source it uses, whether it trades the current active contract, and what happens when volatility spikes. The risk checklist includes event exclusions, maximum daily drawdown, contract-count limits, stale-signal protection, duplicate-alert suppression, and visibility into rejected or partially filled orders.
For users evaluating a TradingView-to-broker workflow, matching the continuous analysis chart to the actual tradable futures symbol is critical. Continuous contract labels can be useful for historical study but are not automatically valid order destinations. Paper-test the entire signal-to-fill lifecycle, including symbol mapping and contract rollover, before allowing real orders. The system can improve consistency of execution; it does not make an unprofitable strategy profitable.
What investors should watch after the November 12 fall
The most useful dashboard pairs price action with the drivers of the move: the gold spot price and active COMEX contract, the US dollar index, two- and ten-year Treasury yields, real-yield measures, Fed-funds futures probabilities and a calendar of major inflation and jobs releases. Those series should be reviewed at matching times rather than combining an Asian-session gold quote with a later US closing yield.
For longer-horizon investors, central-bank demand and diversification motives remain relevant even when a one-day price decline is driven by yields. But official-sector purchases do not guarantee a bottom, and physical demand can coexist with months of price volatility. The disciplined question is not “where must gold go next?” It is “which observable developments would strengthen or weaken each market scenario?”
Bottom line: a break of $4,000 is a test, not a verdict
Gold trading below $4,000 is important because of the macro forces behind it: stronger US inflation, a dollar rebound and more hawkish rate expectations. On November 12, the market was reassessing the policy path, not resolving it. Both further declines and a sharp countertrend recovery remain possible, while a volatile range around the threshold could punish impatient trades.
TradeLuma’s approach is to separate the market thesis from execution. Define the instrument, data timestamp, setup, invalidation, position size and conditions for standing aside. That framework is more durable than treating a dramatic gold headline as a forecast.
Frequently asked questions
Why did gold fall below $4,000 in November 2026?+
Hotter-than-expected October US inflation and hawkish Fed commentary raised expectations of a December rate hike. A stronger dollar and elevated bond yields increased pressure on non-yielding bullion.
What was the gold price on November 12, 2026?+
Reuters reported spot gold around US$3,978 in an earlier Asian-market snapshot and approximately US$3,931.54 in a later Thursday report. Both are dated observations, not a single closing price.
Is gold at $4,000 a guaranteed support level?+
No. $4,000 is a prominent psychological reference. Whether it functions as support or resistance depends on actual price acceptance and market conditions.
Can gold rise while the Federal Reserve raises rates?+
Yes. Gold reacts to expectations, real yields, currencies, risk sentiment and physical demand. Rate hikes can weigh on gold, but they do not mechanically determine its price.
How much is a $10 move in gold worth on one MGC contract?+
One Micro Gold futures contract represents 10 troy ounces. A $10 move per ounce corresponds to a $100 gross change in contract value, excluding fees and slippage.
Is the Fed definitely raising rates by 50 basis points in December?+
No. Reuters reported a November 12 market-implied snapshot that favoured a 25-basis-point increase over a 50-basis-point move. The December 8–9 meeting and future data determine the eventual decision.
What is the next scheduled US inflation catalyst after the CPI surprise?+
The US Producer Price Index release is scheduled for Friday, November 13, 2026. Its result was not known at this article’s publication.
Does a spot XAU/USD quote equal a gold futures quote?+
No. Spot prices and futures prices have different settlement conventions and can diverge. Always verify whether the reported price refers to spot gold, GC or MGC and note the observation time.
Put it into practice
Use the risk maths next to the guide.
Open TradeLuma's free position-size, risk/reward, expectancy, and drawdown tools to test the numbers behind a risk-management decision.
Open free trading calculators →Continue learning
Related guides.
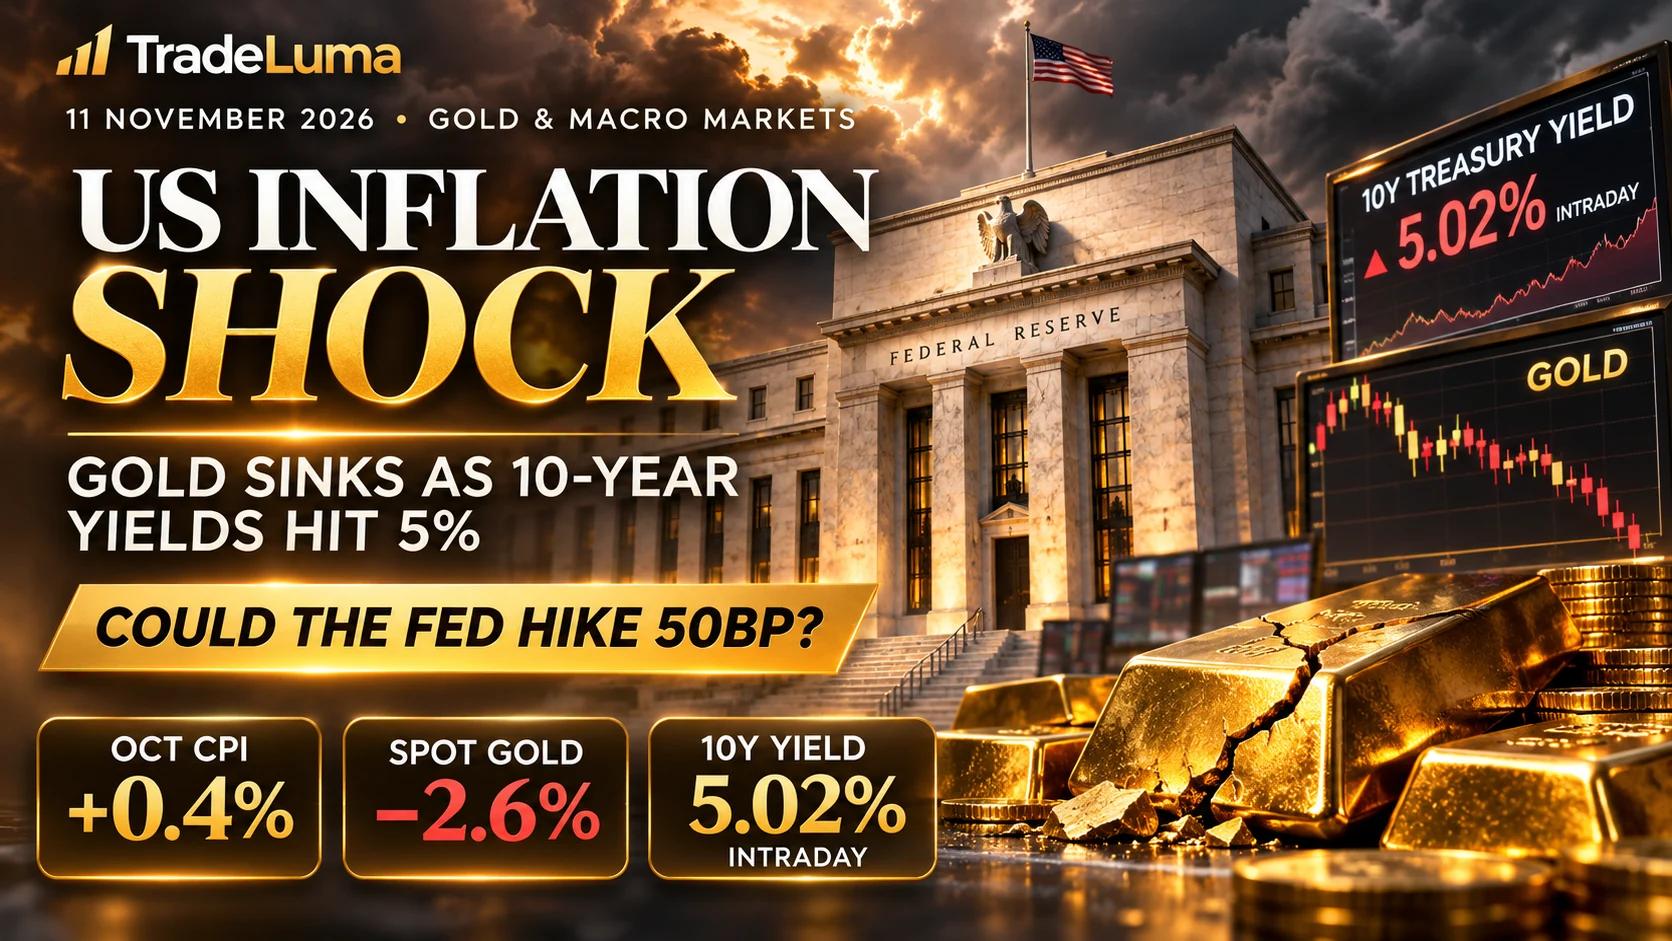
US Inflation Shock: Gold Sinks as Treasury Yields Hit 5% — Will the Fed Hike 50 Basis Points?
October US CPI beat forecasts, gold slid 2.6%, the 10-year yield briefly topped 5%, and the Nasdaq fell. Could a 50bp Fed hike follow?

FOMC Meeting October 2026: Fed Rate Decision Time, Expectations & Gold/Nasdaq Impact
October 2026 FOMC decision time in New York and Australia, Fed rate expectations, statement and press conference explained, plus gold and Nasdaq trading risks.

Oil Price Crash November 2026: Brent Below $100, Iran Peace Hopes and the Gold Trade
Brent oil plunged around 17% in the week ending Nov 6, 2026. Explore US–Iran diplomacy, Hormuz risk, WTI, gold, inflation and what oil traders should watch.