
Gold & Macro Markets
US Inflation Shock: Gold Sinks as Treasury Yields Hit 5% — Will the Fed Hike 50 Basis Points?
October US CPI beat forecasts, gold slid 2.6%, the 10-year yield briefly topped 5%, and the Nasdaq fell. Could a 50bp Fed hike follow?
On this page+
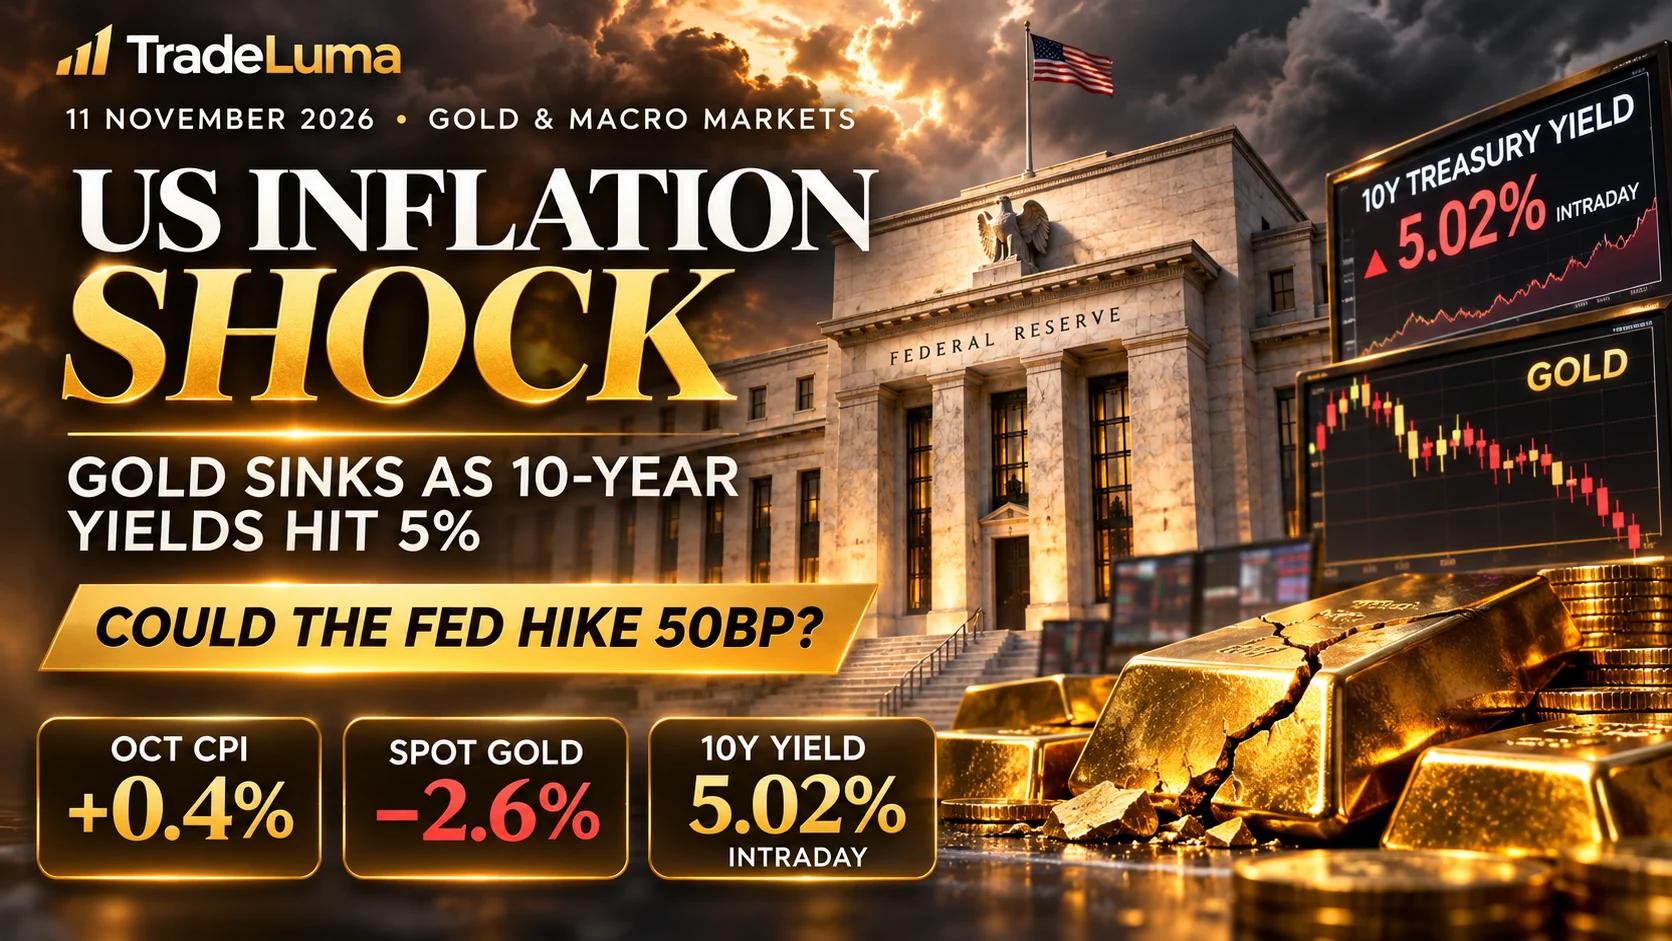
The October US inflation report landed on November 10, 2026, and quickly changed the market's tone. Headline consumer prices rose 0.4% for the month versus a 0.3% consensus, while core inflation rose 0.3% versus 0.2% expected. Gold dropped 2.62% to roughly $4,030.56 an ounce in Reuters' late-session market wrap; the benchmark 10-year Treasury yield touched approximately 5.023% intraday before easing to about 4.988%, while the Nasdaq Composite lost 0.74%. Federal Reserve Governor Christopher Waller had just said a 50-basis-point December increase deserved consideration if core prices were running at 0.3% or more. That threshold was met, but it does not make a half-point hike certain: most futures-based pricing still favoured a quarter-point increase. Here is what the CPI actually showed, why gold sold off despite longer-term central-bank demand, how bond yields pressured growth stocks, and what to monitor next.
October 2026 CPI: the exact figures that rattled markets
The Bureau of Labor Statistics reported that the seasonally adjusted Consumer Price Index for All Urban Consumers increased 0.4% in October after a 0.6% rise in September. Economists surveyed by Reuters had expected a 0.3% increase. The CPI excluding food and energy—the commonly quoted core CPI measure—rose 0.3%, compared with an expected 0.2%. That one-tenth-of-a-percentage-point core surprise mattered because investors had been hoping for evidence of fading inflation pressure.
The report did not mean inflation accelerated from September in the headline monthly comparison: October’s 0.4% reading was lower than September’s 0.6%. The problem for markets was that both readings remained elevated and October was hotter than forecast. A single monthly data point should not be converted into a confident prediction of future prices, but it can cause a rapid repricing of central-bank expectations.
Why there is no normal October year-over-year CPI figure
The BLS did not publish the usual twelve-month October 2026 CPI change because the federal shutdown in October 2025 interrupted the collection of data required for a comparable base. This is an unusual but important limitation. It means articles using a fabricated October annual inflation reading—such as a calculated value from an incomplete series—would give readers a false sense of precision.
September 2026 annual inflation was reported at 3.7%, but that is a different reference month and should not be labelled the October rate. For interpreting this report, the reliable direct comparison is the seasonally adjusted monthly increase and the individual price categories. The absence of one annual figure does not invalidate the monthly survey results; it changes which comparisons can be made responsibly.
What drove the price increase: shelter, food and energy
The October shelter index advanced 0.3% and accounted for more than 30% of the monthly headline CPI increase, according to the BLS. Food prices rose 0.5%; within that, groceries increased 0.4% and food away from home also rose 0.5%. Energy rose 0.7%, following a much larger 5.2% September increase. The combination illustrates why inflation can remain uncomfortable even when one volatile category cools.
These components matter because the central bank considers both how quickly prices are rising and how broadly the pressure is spreading. Slowing gasoline inflation alone would not establish that shelter and services have become benign. Similarly, one strong food-price month does not mean households will experience the same rate of change continuously. Investors should look for several sequential reports showing durable moderation.
How gold lost 2.6% on an inflation day
Gold is often described as an inflation hedge, so a sharp sell-off following a hot CPI number can seem counterintuitive. The missing step is monetary policy. If persistent inflation raises the expected path of US interest rates, the return investors can earn from Treasury securities rises. Gold does not pay interest, so its opportunity cost can increase, particularly when inflation-adjusted bond yields also move higher.
The US dollar also strengthened after the report, making dollar-denominated bullion more expensive for many holders using other currencies. Reuters reported spot gold down 2.62% to approximately $4,030.56 per ounce in its late-November-10 wrap. That is a dated report at a specified observation point: spot-market, futures-settlement and real-time quotes may differ by venue, instrument and minute.
The 10-year US Treasury yield briefly crossed 5%—but did not finish there
The benchmark 10-year Treasury yield briefly reached around 5.023% intraday on November 10, according to market reporting, before ending the session around 4.988% in Reuters’ closing wrap. This distinction is essential: a headline saying the yield “hit 5%” is fair when the high was recorded, whereas a statement that it closed above 5% would be inaccurate. Bond yields and bond prices move in opposite directions; the jump reflected a sell-off in Treasury securities.
The move was not simply a vote on the next Fed decision. Ten-year yields also reflect expectations for inflation, economic growth, issuance, term premiums and future short-term rates. A 5% print is a psychologically significant threshold, but markets do not become fundamentally different at exactly 5.00%. What matters more is whether elevated yields persist and whether the rise is dominated by real rates or inflation compensation.
Why the two-year yield matters just as much for the Fed trade
The policy-sensitive two-year Treasury yield rose approximately 18.44 basis points to 4.731% on November 10, its biggest daily rise since April 2025, Reuters reported. Its sharper move relative to the ten-year yield suggested that investors were rapidly revising near-term policy expectations. One basis point equals 0.01 percentage point, so an 18-basis-point increase is about 0.18 percentage point—not an 18% increase in the yield.
A two-year yield is not a direct prediction of the Fed policy rate. It incorporates the anticipated sequence of interest rates over the security’s remaining life and a variety of market premiums. Still, comparing the front end of the curve with the ten-year benchmark helps traders distinguish immediate monetary-policy anxiety from longer-term sovereign-debt concerns.
What Christopher Waller actually said about a 50-basis-point hike
In remarks delivered before the CPI publication on November 10, Federal Reserve Governor Christopher Waller said he was leaning toward a 25-basis-point increase at the December 8–9 meeting under his base-case inflation outlook. He then added a conditional warning: if the October core CPI reading resembled the preceding elevated months—around 0.3% or more—then a 50-basis-point increase should be considered to protect the central bank’s inflation-fighting credibility.
October core CPI subsequently came in at exactly 0.3%. That matched Waller’s threshold but was not a binding policy decision, nor did he speak for every member of the Federal Open Market Committee. December’s outcome depends on additional data, internal deliberation and the balance between inflation and employment risks. A conditional statement from one official is evidence of a live debate, not proof the Fed will raise rates by half a percentage point.
What Fed futures actually priced after the inflation release
Pricing shifted materially after the report, but investors were not treating a 50-basis-point rise as the most likely outcome. Barron’s cited CME FedWatch probabilities of roughly 86.4% for a quarter-point increase and 13.6% for a half-point increase in one post-report snapshot. Other reporting calculated somewhat different percentages as markets moved, underscoring why a probability must always be accompanied by its timestamp and methodology.
The takeaway is the direction of change: the hotter print moved larger-hike risk from a remote possibility into the range investors needed to consider. Fed-funds futures probabilities are market-implied estimates, not independent forecasts of the true likelihood. Liquidity, contract structure and changing market prices can alter them during the trading day.
Does this change the outlook for Nvidia and the AI infrastructure trade?
Higher Treasury yields can compress valuation multiples for expensive growth shares, but AI infrastructure companies face an additional issue: the cost of funding data centres, power connections and equipment. If bond yields remain elevated, highly leveraged operators may need to refinance at more expensive rates or slow capital investment. Large technology groups with substantial internal cash flow are not exposed in the same way as thinly capitalised infrastructure providers.
The spillover is therefore uneven. AI chip demand, cloud-contract quality and utility construction schedules are separate from the Fed’s immediate policy decision. A responsible assessment should compare each company’s financing profile, maturity schedule, contractual revenue and spending commitments instead of declaring that higher rates automatically end the AI cycle.
Why a stronger dollar can amplify gold and commodity moves
Gold, many energy contracts and numerous globally traded commodities are commonly quoted in US dollars. When the dollar appreciates, a buyer holding euros, yen or other currencies may face a higher local-currency cost even if the dollar commodity price is unchanged. This translation effect can temporarily suppress international demand or exacerbate a speculative unwinding.
The relationship is not mechanical. Gold can sometimes rise alongside the dollar during systemic stress, and commodity prices are also influenced by supply disruptions, physical inventory, local premiums and investor hedging. The correct interpretation of November 10 is that rising yields and dollar strength coincided with a sharp drop in bullion; correlation in one trading session does not establish a permanent rule.
Central banks are buying gold—so why can it still crash?
TradeLuma’s recent article on China’s October reserve accumulation describes one long-term source of gold demand. Official-sector purchases, however, are generally evaluated over many months and can be smaller on a given trading day than speculative flows through exchange-traded funds, over-the-counter markets and futures. A central bank can hold a long-duration reserve objective while leveraged traders unwind positions in minutes.
It is also impossible to assume that every announced monthly reserve addition occurred precisely during the worst price decline. Public reserves data typically report end-of-period holdings, not tick-by-tick execution details. November’s inflation reaction and China’s reserve strategy answer different questions: one is about the immediate price of money, the other about long-horizon reserve diversification.
Is $4,000 gold the next support level?
With spot gold near $4,030 in late-November-10 reporting, the round $4,000 level was likely to attract attention from chart-based traders, options desks and financial headlines. A big round number can become a point of concentrated orders, but it is not a binding economic value and does not guarantee a bounce. A sharp move through it would not, by itself, demonstrate a new fundamental regime.
Instead of assuming support will hold, traders can watch the price response around the level, liquidity at the time of the test, volatility and whether US real yields and the dollar continue rising. Different venues have different spreads and contracts; a chart based on spot XAU/USD is not necessarily identical to CME futures. The cover’s red chart is a conceptual editorial visual, not recorded market data.
Gold futures and micro gold: why CPI days deserve smaller risk budgets
CPI releases can produce abrupt price gaps, changing spreads and rapid stop cascades. Traders in COMEX gold futures or Micro Gold futures (MGC) are exposed to leveraged moves, so an apparently small percentage change in the underlying price can create a much larger change relative to posted margin. Stops and limit orders cannot always guarantee execution at a planned level in extreme volatility.
A practical framework is to calculate position risk from contract specifications and a planned invalidation point, then account for slippage and the chance of a delayed fill. Reducing size, waiting for spreads to normalise or choosing not to trade the announcement can be more disciplined than guessing the first move. This is general market education, not a trade recommendation or specific position-sizing instruction.
Bitcoin and other risk assets: macro repricing is not exclusive to equities
Cryptocurrencies were also under pressure as investors reassessed the Fed path and broader risk appetite. Bitcoin traded around the mid-$73,000 area in November 10 closing-market summaries, although cryptocurrency venues do not have the same unified daily closing time as the NYSE. A snapshot from one provider is not a universal closing price.
Crypto assets have their own liquidity, leverage, exchange and security risks, so their intraday changes cannot be explained solely by inflation data. The common thread is sensitivity to funding conditions and risk appetite. When yields rise sharply, positions financed cheaply or justified by aggressive future-growth assumptions can become harder for investors to hold.
What do higher US yields mean for the Australian dollar and ASX?
A US inflation surprise can propagate into global markets through exchange rates, bond yields and cross-border equity valuations. A stronger US dollar may pressure the Australian dollar, all else equal, while higher Treasury yields may influence the pricing of Australian government bonds and high-duration shares. The direction and magnitude of these effects depend on local economic releases, the Reserve Bank of Australia’s stance and commodity demand.
For Australian investors holding US shares or gold exposure, currency conversion can materially change AUD-denominated returns. A gold decline in USD may not translate into an identical percentage fall in AUD if the Australian dollar simultaneously weakens. Traders should distinguish the instrument’s quoted currency from the currency in which they judge performance.
Three scenarios for the December 8–9 Fed decision
Base case: the Fed raises rates 25 basis points and continues to emphasise dependence on inflation and employment data. That was the dominant futures-implied outcome immediately after the October CPI shock. Markets could still react strongly if the accompanying statement or press conference signals a faster 2027 path than investors expect.
Hawkish scenario: policymakers judge the persistence of core inflation sufficient for a 50-basis-point increase, potentially lifting short-dated yields and pressuring valuation-sensitive assets. More benign scenario: subsequent data moderate or the Fed communicates a slower path, allowing some of the post-CPI dollar and bond repricing to unwind. These are conditional scenarios—not probabilities, forecasts or promised directions for gold.
Which data releases and events matter next?
The Federal Open Market Committee’s next scheduled meeting is December 8–9, 2026. Ahead of it, investors will assess incoming employment, spending, inflation and business-activity evidence, alongside speeches from policymakers. The BLS has scheduled the next monthly CPI release, covering November, for December 10—after the December meeting—so it cannot be assumed the committee will have that particular figure when it votes.
That calendar creates more uncertainty, not less. Officials may have other inflation measures or partial information available before the meeting, but traders should not invent a November CPI result. The most useful process is to keep a dated catalyst calendar, note which indicators are released before or after the decision, and watch how Fed funds and Treasury yields respond to each new piece of evidence.
Bottom line: inflation shocked markets, but 50bp is not the base case
October’s CPI report was a genuine upside surprise. It lifted the expected path of US interest rates, briefly pushed the ten-year Treasury yield above 5%, strengthened the dollar and coincided with a sharp gold sell-off and a negative Nasdaq session. The real story is not that gold has permanently ceased to protect against inflation, but that monetary-policy repricing can overwhelm a longer-term inflation narrative in the short run.
Waller’s conditional warning gave the 50-basis-point scenario credibility; futures markets still placed much greater weight on a 25-basis-point December move at the time of publication. For gold, Nasdaq and futures traders, the next question is whether economic data validate the higher rate path—or prompt another reversal. The best article headline is dramatic, but the decision-making should remain conditional, dated and risk-aware.
Frequently asked questions
What was the October 2026 US inflation rate?+
The headline CPI rose 0.4% month-on-month, while core CPI rose 0.3%. The BLS did not issue a usual October year-over-year figure because the October 2025 comparison base was missing due to the federal shutdown.
Why did gold fall after US inflation came in high?+
Hotter inflation increased expectations for Fed rate hikes, lifting Treasury yields and the US dollar. Higher interest-bearing alternatives can raise gold’s opportunity cost even as some investors buy it as a long-term inflation hedge.
How far did gold fall on November 10, 2026?+
Reuters reported spot gold down about 2.62% near US$4,030.56 an ounce in its late-session November 10 wrap. Other market snapshots and futures settlements can differ.
Did the US 10-year Treasury yield actually cross 5%?+
Yes, market reporting recorded an intraday high around 5.023% on November 10. Reuters subsequently reported the yield around 4.988%, below 5%, at the late-session observation.
Will the Federal Reserve raise interest rates by 50 basis points in December 2026?+
That outcome was under discussion after Fed Governor Christopher Waller gave a conditional warning, but market-implied probabilities continued to favour a 25-basis-point rise at the time of the CPI release.
What did Fed Governor Christopher Waller say?+
He said he leaned toward a quarter-point December increase but that a half-point increase should be considered if core inflation came in near 0.3% or higher. October core CPI was 0.3%.
How did the Nasdaq react to the CPI report?+
The Nasdaq Composite fell about 0.74% on November 10, while the S&P 500 declined about 0.38%. Higher interest-rate expectations were a key market driver, alongside company-specific news.
Is US$4,000 a guaranteed support level for gold?+
No. US$4,000 is a prominent round-number reference, not a floor. Prices can cross technical levels quickly, especially around economic releases and market gaps.
Why is China still buying gold if prices are falling?+
Central-bank reserve diversification plays out over years, while spot and futures prices react to daily funding costs, investment flows and currency moves. Their time horizons and objectives differ.
When is the next US CPI release?+
The Bureau of Labor Statistics scheduled November 2026 CPI to be published on December 10, 2026, one day after the scheduled December 8–9 Federal Reserve meeting.
Are futures traders at extra risk during CPI announcements?+
Yes. High leverage, fast price moves, wider spreads and slippage can make CPI sessions unusually volatile. Actual risk depends on the contract, position size, margin and execution conditions.
Does higher US inflation always push gold lower?+
No. Gold responds to inflation expectations, real yields, the dollar, risk appetite, central-bank demand and other forces. A one-day negative reaction is not a universal rule.
Put it into practice
Use the risk maths next to the guide.
Open TradeLuma's free position-size, risk/reward, expectancy, and drawdown tools to test the numbers behind a risk-management decision.
Open free trading calculators →Continue learning
Related guides.

Oil Price Crash November 2026: Brent Below $100, Iran Peace Hopes and the Gold Trade
Brent oil plunged around 17% in the week ending Nov 6, 2026. Explore US–Iran diplomacy, Hormuz risk, WTI, gold, inflation and what oil traders should watch.

US CPI November 2026 Preview: Why October's Annual Inflation Data Are Missing—and What Gold and Nasdaq Traders Should Watch
US October 2026 CPI arrives 10 November. Learn why most annual CPI rates will be unavailable, what monthly inflation shows, and the implications for gold, Nasdaq and Fed rates.

Hawkish vs Dovish Fed Explained: Interest Rates, Gold, Nasdaq & Market Reactions
Hawkish vs dovish explained with real Fed examples, rate-cut surprises, Treasury yields and potential impacts on gold, Nasdaq and futures trading.