
Commodities & Macro
Oil Price Crash November 2026: Brent Below $100, Iran Peace Hopes and the Gold Trade
Brent oil plunged around 17% in the week ending Nov 6, 2026. Explore US–Iran diplomacy, Hormuz risk, WTI, gold, inflation and what oil traders should watch.
On this page+
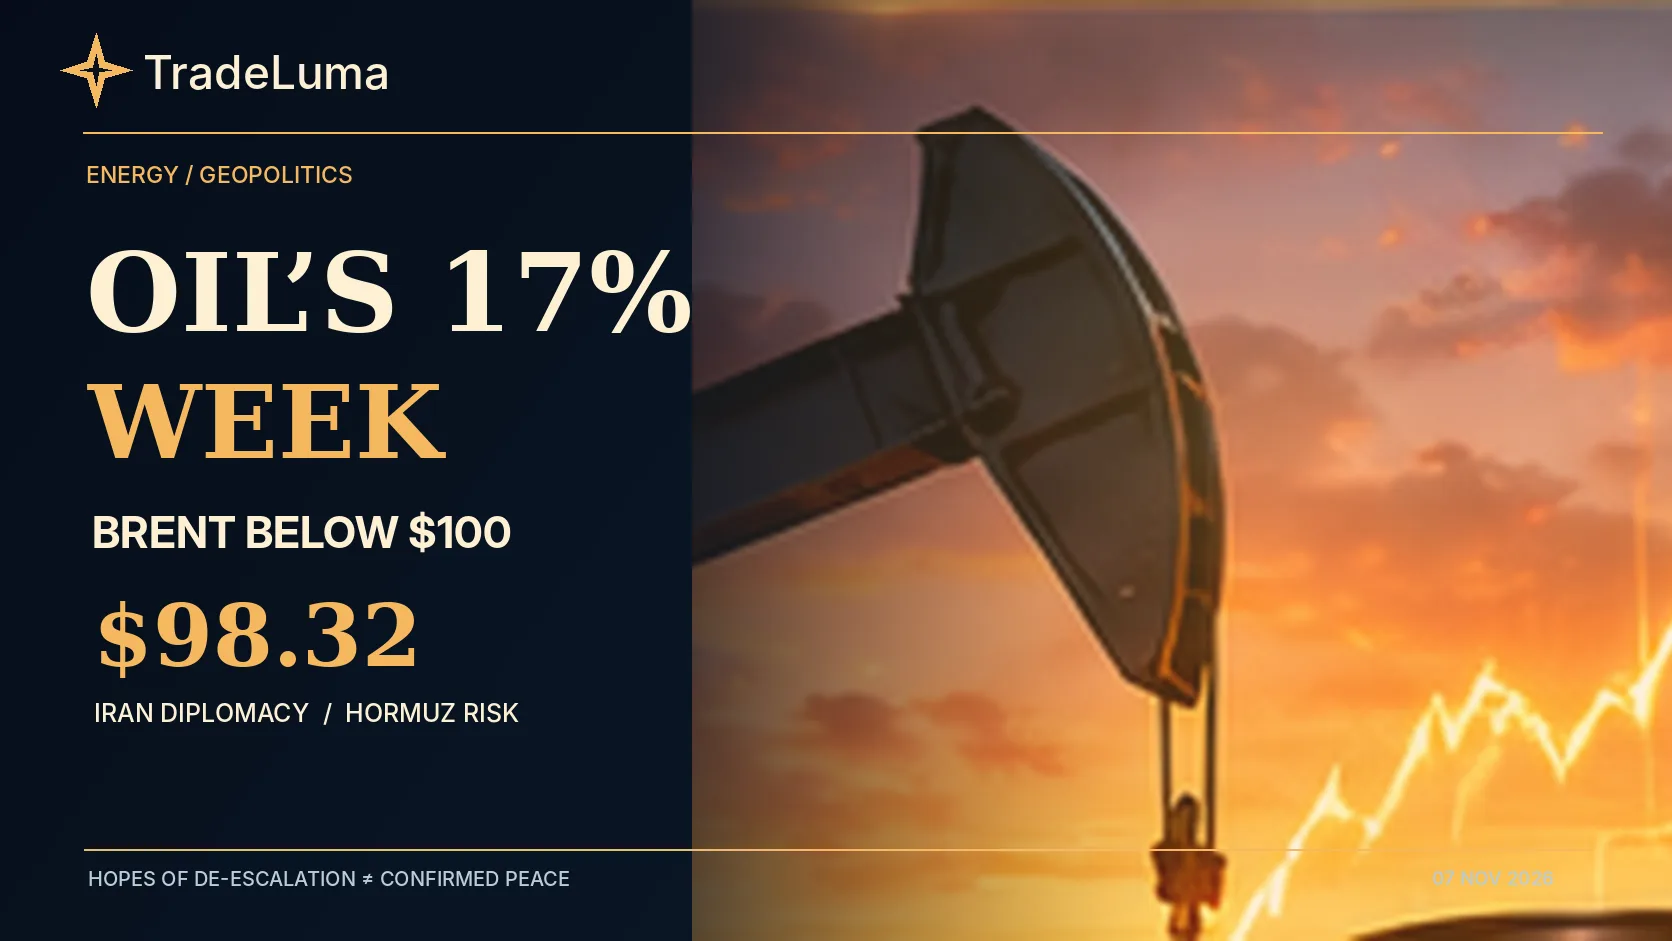
Crude oil delivered one of the most dramatic market reversals of November 2026. After months of a substantial war-related risk premium, Brent settled at about $98.32 per barrel on Friday, November 6, while US West Texas Intermediate finished near $90.83. Brent's weekly decline was approximately 17%, an extraordinary retreat driven in part by hopes that shifting US politics might produce diplomatic progress with Iran. But this was not a confirmed end to the conflict: tanker attacks, continuing threats and disputes around the Strait of Hormuz kept serious supply risks alive. At the same time, gold had risen on haven demand and falling yields earlier in the week. Why did oil tumble while some safe havens strengthened, and what should crude, gold and Nasdaq traders monitor next? This guide separates verified settlement prices and policy developments from the uncertain scenarios embedded in futures markets.
What happened to oil prices in the week ending November 6, 2026?
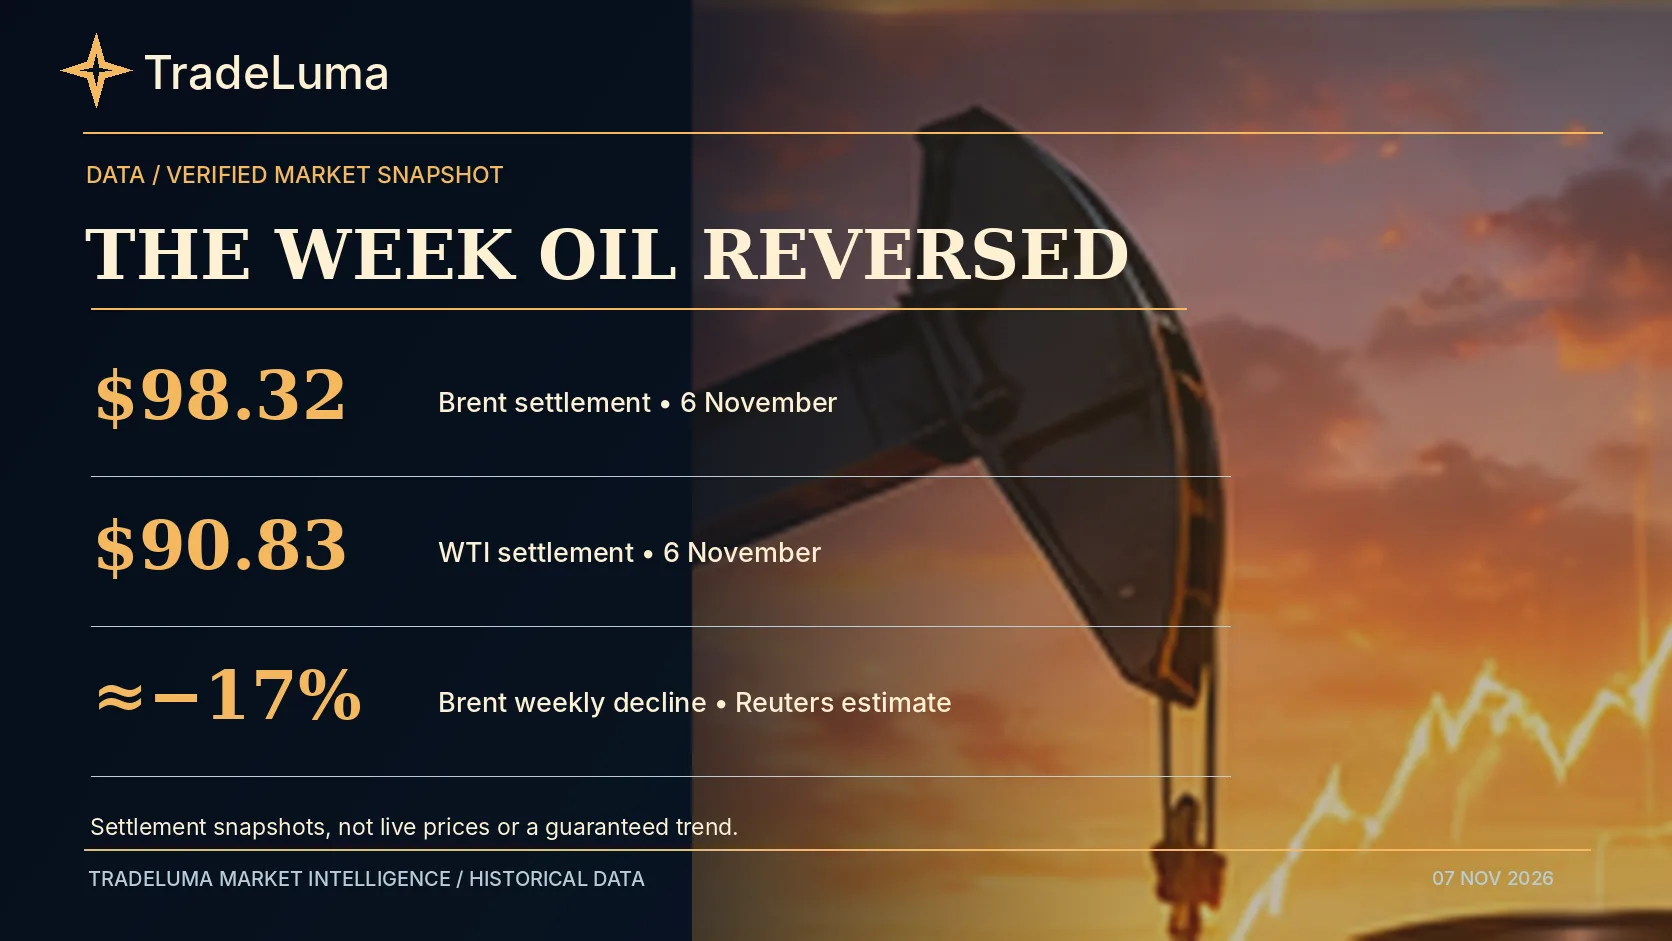
Brent crude settled at approximately $98.32 a barrel on Friday, November 6, almost unchanged on the day, while West Texas Intermediate rose modestly to about $90.83. Yet the weekly picture was extraordinary: Reuters reported Brent was heading for roughly a 17% weekly decline and WTI about a 13% fall, among the sharpest reductions in the recent oil shock.
The headline 'oil crashed' refers to this cumulative repricing, not to a 17% loss during Friday alone. Daily trading included sharp rebounds as renewed geopolitical headlines interrupted the decline. A weekly percentage is sensitive to settlement windows and futures contract choice, so compare identical benchmarks and dates.
What changed after the 2026 US midterm elections?
The November 3 elections produced a shift in control of Congress. Some investors interpreted the new political balance as increasing pressure for a diplomatic resolution or reducing the chances of sustained military escalation. Oil prices fell sharply as those expectations were incorporated into trading.
These are expectations rather than binding decisions. Congressional politics can affect pressure, funding and oversight, but the executive branch, foreign governments, security conditions and many other actors influence diplomacy. A market rally in optimism about negotiations is not proof that a ceasefire has been signed.
Were the US and Iran actually close to a peace deal?
Public reports on November 6–7 described active diplomatic contacts involving regional governments alongside continued disagreement about the terms of a ceasefire. US officials also warned that further strikes remained possible, and there were reports of limited military operations. There was no verified comprehensive agreement ending the conflict by the publication date of this article.
This matters because the futures market can price a significant probability of de-escalation without it having occurred. An optimistic headline may remove the premium for one scenario, while new threats or military incidents can restore some of that premium within minutes.
Why the Strait of Hormuz still dominates the risk calculation
The Strait of Hormuz is a narrow maritime route connecting the Persian Gulf with global oil markets. Shipping through this corridor is strategically important for crude and refined products exported by several producers. Disruption can raise freight costs, insurance premiums and delivery times even if oil wells continue operating.
Reuters reported further tanker-security incidents, including a deadly explosion involving a vessel near the Gulf on November 5. These developments show why a fall in futures prices does not remove the need to monitor maritime conditions. Traders should be cautious about assuming normal exports and shipping costs will immediately resume.
Physical oil supply and demand can accelerate a geopolitical reversal
When market participants begin unwinding a geopolitical premium, their focus may shift to inventories, expected demand and the price of readily available barrels. Contemporary reporting also highlighted weaker Middle Eastern spot crude premiums and concern about excess supply relative to demand as secondary contributors to the price retreat.
Physical indicators such as crude differentials, refinery margins, floating storage, tanker traffic and OPEC+ production decisions can help distinguish a political sentiment move from a sustained change in oil balances. Their publication dates, quality and coverage differ, so no single metric should be overinterpreted.
Brent versus WTI: why the two crude benchmarks have different prices
Brent reflects a widely used international waterborne crude benchmark, whereas WTI is a major US light sweet crude reference. Quality, delivery logistics, storage, export capacity and regional demand affect the spread between them. On November 6, Brent around $98.32 and WTI around $90.83 implied a gap of roughly $7.49 per barrel.
The two benchmarks often move together during global geopolitical events but not identically. Traders in WTI futures or micro WTI contracts should not assume a headline about Brent translates one-for-one into the price, liquidity or rollover behaviour of their own contract.
Does cheaper oil mean US inflation will fall?
Lower crude can reduce gasoline and diesel production costs over time, contributing to softer transportation prices and the headline Consumer Price Index. The speed and extent of pass-through depend on refinery economics, taxes, distribution margins, contracts and local fuel supply. A steep crude decline does not automatically make consumer prices fall by the same percentage.
Energy prices can influence inflation expectations and monetary-policy pricing, particularly when the previous months saw an oil-driven inflation shock. The US October CPI release scheduled for November 10 will report a past reference month and may not fully reflect a price drop concentrated in early November.
Why the Federal Reserve and Treasury yields are part of the oil story
Energy shocks can complicate central-bank policy because higher fuel costs reduce household spending power while pushing near-term headline inflation up. A persistent oil decline may relieve some inflation pressure and alter expectations for policy rates, supporting duration-sensitive assets in some scenarios.
Yet the strong US October jobs report released November 6 could support a more restrictive rate outlook, and oil declines may also reflect demand weakness. The impact on nominal and real Treasury yields therefore depends on whether markets interpret falling oil as supply relief, a growth warning or both.
Why gold rallied while crude collapsed
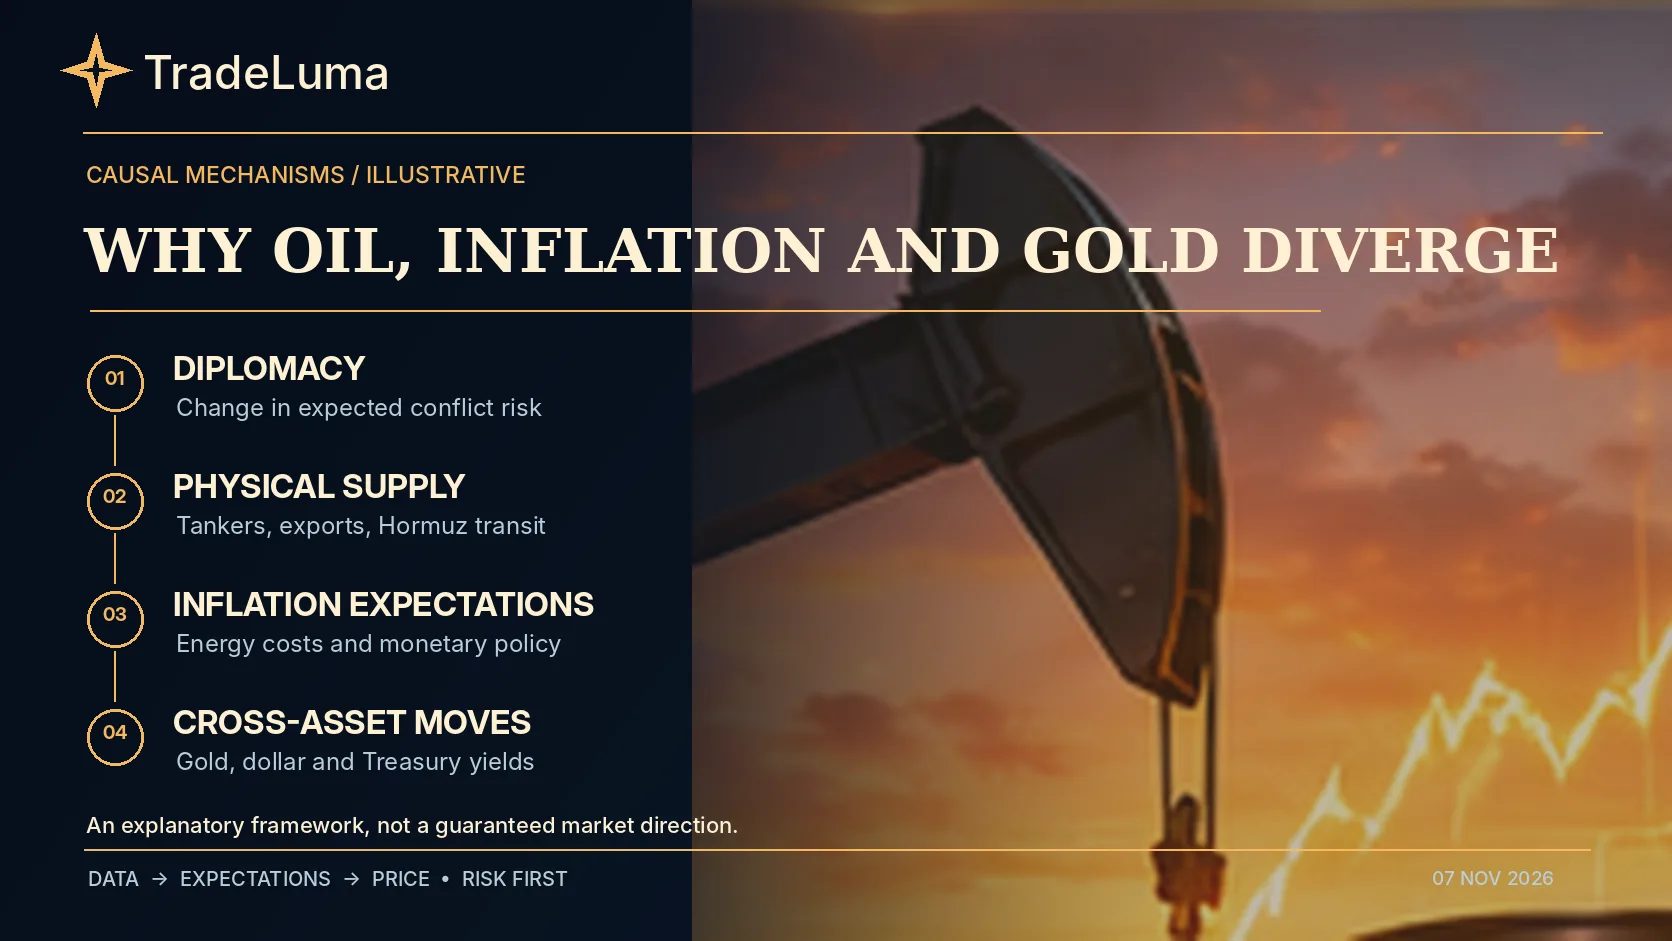
Gold and crude react to overlapping but different forces. Oil prices are highly sensitive to expected physical supply and demand, while gold responds to real yields, the US dollar, central-bank demand and geopolitical hedging. During the early-November turbulence, reports indicated that gold had traded above $4,100 an ounce as investors sought safety and bond yields fell.
An easing war premium can push oil down but might also reduce some demand for gold as a hedge. Alternatively, equity market stress can support gold even when oil is selling off. These cross-asset relationships can change by session and are not consistent enough to support a guaranteed paired trade.
What the oil move could mean for Nasdaq and AI stocks
Lower energy prices can reduce costs for transport-intensive businesses and soften inflation fears, but the effect on AI infrastructure is less direct. Data centres use electricity under a variety of regional pricing structures, and power costs are shaped by gas, renewables, transmission, grid demand and contracts—not just the front-month crude price.
Nasdaq performance in the week was driven heavily by AI valuations, election uncertainty and earnings alongside broader macroeconomic conditions. A plunge in oil does not prove the technology sector should rebound, though a less inflationary energy outlook might eventually support yields and risk appetite.
Could the oil decline reverse rapidly?
Yes. A renewed attack near key shipping lanes, a breakdown in negotiations, unexpected export curtailments or another major supply disruption could rapidly restore a scarcity premium. Conversely, concrete de-escalation, more reliable shipping and improved exports might reinforce lower prices.
Both directions are scenarios, not predictions. Traders should focus on whether new information changes the probability and duration of a supply disruption, rather than treating either a peace headline or military threat as conclusive.
Practical risk checklist for crude futures and micro crude traders
Crude futures are leveraged, and news-driven gaps can exceed standard stop distances. Check whether a quote refers to Brent, WTI, a specific delivery month or a continuous chart; consider spread behaviour, trading-session liquidity, overnight headline risk and contract expiry. For micro crude products, tick value and exposure per contract differ from larger contracts.
An automated strategy should account for rollover mapping, stale quotes, order-entry expiry, maximum loss, close escalation and instrument-specific volatility. A large historical weekly oil price change is a reason to reassess assumptions, not a guarantee that similarly large trades can be executed at the displayed prices.
What to watch after November 7: diplomacy, shipping and inflation
Monitor verified announcements from negotiating parties, Gulf shipping security and evidence of actual export flows. Watch weekly petroleum inventory reports, benchmark spreads, refinery margins and physical premiums. For cross-asset context, US CPI on November 10 and subsequent Federal Reserve communications may affect dollar and real-yield reactions.
The important distinction is between headlines that change probability and facts that change supply. An apparent negotiation breakthrough might be reversed; improved tanker flow or lower insurance costs would provide a different kind of evidence.
Bottom line: oil priced out some war fear, not all geopolitical risk
Brent below $100 on November 6 represented a remarkable unwinding of a risk premium built over months of conflict. Yet diplomatic hope, physical supply signals and renewed tanker dangers all contributed to the same volatile week.
For TradeLuma readers, this is a case study in why oil, gold, equities and the dollar can diverge around the same geopolitical event. Treat the reported settlement values as historical observations and future price outcomes as uncertain—not as a mechanical 'oil down, gold up' trading rule.
Frequently asked questions
Why did oil prices crash in November 2026?+
Oil fell sharply as investors reduced the premium for a prolonged disruption of Middle East crude supplies amid hopes for US–Iran diplomatic de-escalation, while demand and supply-balance concerns also contributed.
What was Brent crude's price on November 6, 2026?+
Brent settled near $98.32 per barrel on Friday, November 6, 2026. It was a time-specific settlement, not a live quote.
What was WTI oil's price on November 6?+
WTI settled at approximately $90.83 per barrel on November 6, 2026.
How much did Brent fall that week?+
Reuters reported Brent was on track for a decline of roughly 17% in the week ending November 6, 2026; percentage changes depend on the contract and comparison window.
Did the United States and Iran sign a peace deal?+
No comprehensive ceasefire or peace agreement was verified as of this article's November 7 publication date. Diplomacy remained uncertain alongside continued security concerns.
Why is the Strait of Hormuz important for oil prices?+
It connects major Persian Gulf energy exporters to international markets. Threats to tanker transit can increase shipping costs and the probability of supply disruptions.
Does a falling oil price make gold rise?+
Not necessarily. Oil reacts to physical supply-demand risks, while gold depends on real interest rates, the dollar, risk sentiment and other factors.
What should crude traders watch next?+
Verified diplomatic outcomes, tanker safety, export flows, crude spreads, inventories and inflation/rates reactions are important, alongside futures leverage and rollover risks.
Put it into practice
Use the risk maths next to the guide.
Open TradeLuma's free position-size, risk/reward, expectancy, and drawdown tools to test the numbers behind a risk-management decision.
Open free trading calculators →Continue learning
Related guides.

Why Are Oil Prices Rising in 2026? Brent vs WTI, Strait of Hormuz & the $100 Oil Shock
Why are oil prices above $100 in October 2026? Understand Brent vs WTI, Strait of Hormuz supply risks, crude inventories, inflation and CL/MCL futures.
US Midterms 2026: Stock Market Winners, Losers & What Happens Next
Which stocks won and lost after the 2026 US midterms? Explore healthcare, housing, clean energy, defence, AI, Nasdaq, gold and Treasury yields.

China Bought 25.8 Tonnes of Gold During a 7% Crash — What Does Beijing Know?
China added 25.8 tonnes of gold in October 2026, its 24th straight monthly increase, despite a 7% price slide. Explore PBOC reserves, dollar risks and gold futures.