
Gold & Global Markets
China Bought 25.8 Tonnes of Gold During a 7% Crash — What Does Beijing Know?
China added 25.8 tonnes of gold in October 2026, its 24th straight monthly increase, despite a 7% price slide. Explore PBOC reserves, dollar risks and gold futures.
On this page+
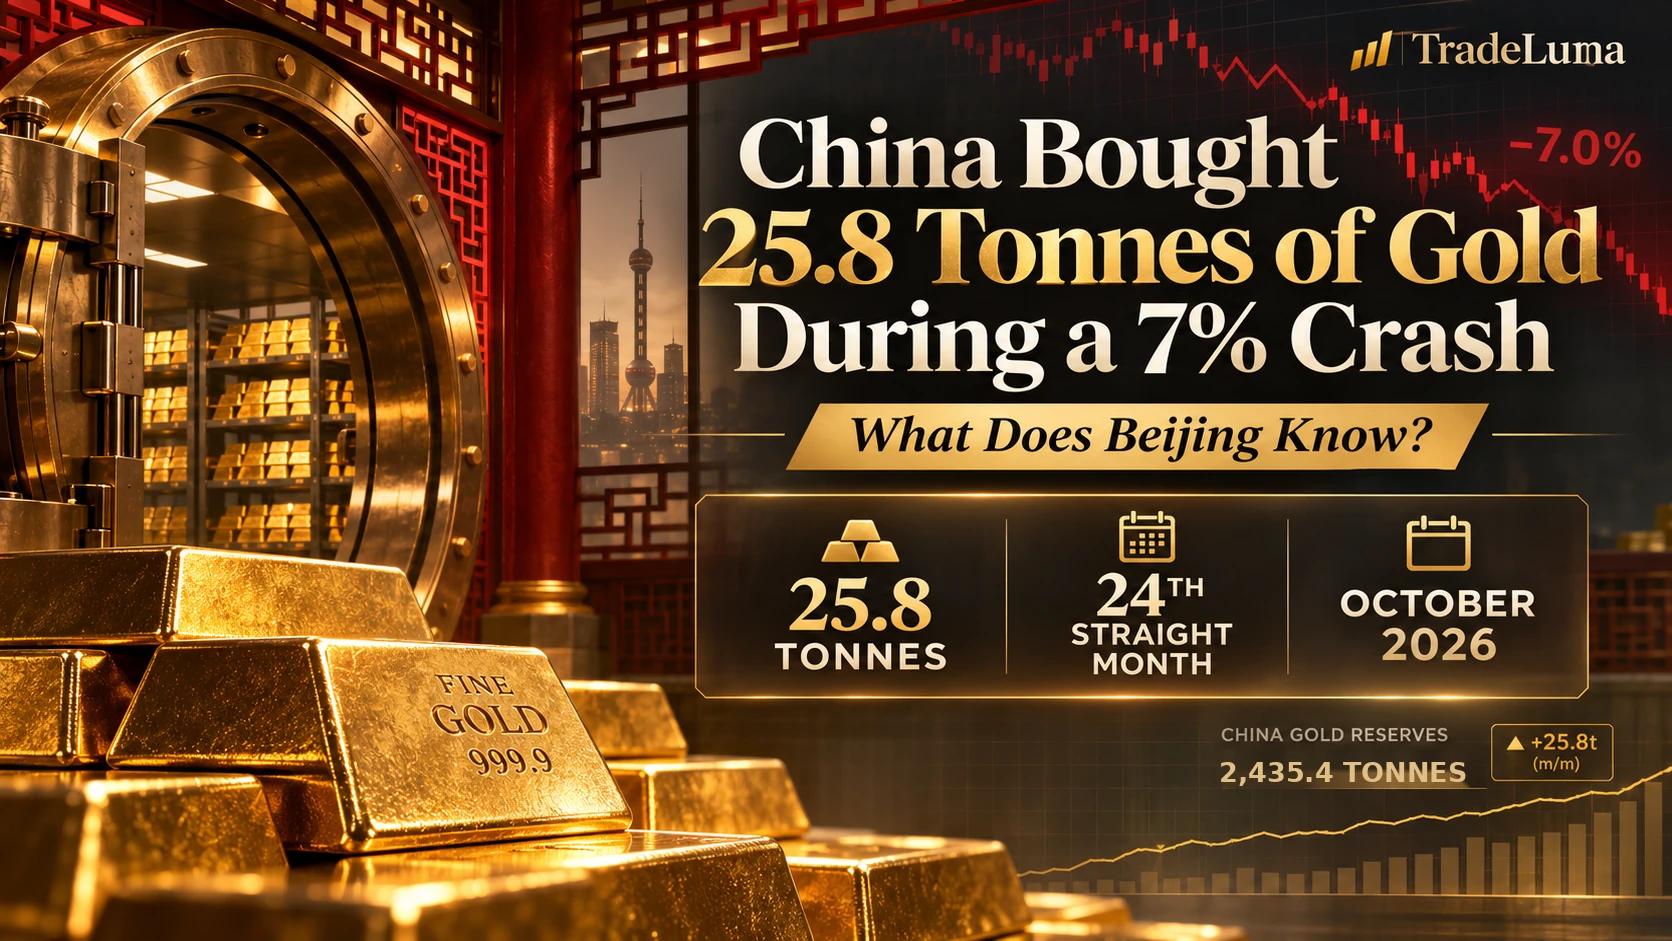
Gold was supposed to be under pressure in October 2026. The metal lost almost 7% during the month and finished below $4,000 an ounce, but the People's Bank of China reported a striking increase in its official bullion holdings: another 830,000 fine troy ounces, or approximately 25.8 metric tonnes. That extended a two-year run of monthly reserve increases and took China's reported gold holdings to 78.30 million ounces, about 2,435.4 tonnes. The contrast is newsworthy, but it needs careful interpretation. The published figures reveal month-end inventory changes—not individual trade dates, execution prices or a secret forecast. Here is what the data establishes, why governments value gold differently from retail traders, and what matters for XAU/USD, gold futures and the upcoming US inflation report.
China’s October gold report: the 25.8-tonne number explained
Figures released by Chinese authorities on November 7 showed official gold holdings of 78.30 million troy ounces at the end of October 2026, compared with 77.47 million ounces a month earlier. The difference is 830,000 troy ounces. Converting at 31.1034768 grams per troy ounce produces approximately 25.816 metric tonnes, commonly rounded to 25.8 tonnes. That is a quantity change, not an estimate of the value of a trade.
In tonnage, 78.30 million ounces is about 2,435.4 tonnes of gold. The reported addition was the largest in roughly three years and kept China’s official accumulation streak going for 24 months. The reserve figures are a month-end snapshot; they do not itemise daily purchases, the venue of execution, or whether any gold was obtained by internal transfers.
Why buying into a 7% gold decline is a surprising headline
Gold’s international price slid by almost 7% in October, briefly trading below $4,000 an ounce and recording an unusually weak month for the traditional safe-haven asset. Central-bank holdings moved in the opposite direction. That divergence invites a compelling question: why would a country add precious metal while private investors and futures markets become more cautious?
The answer may be as straightforward as different time horizons. Official reserve managers can think in decades, whereas a leveraged gold futures trader can face margin calls within hours. A reserve addition does not mean the central bank expects an immediate rebound, and a falling spot price does not prove that the purchase was profitable. The headline should not be read as proof that Beijing timed an October low.
The 24-month streak: what the history does—and does not—show
China’s reported gold holdings have risen each month from November 2024 through October 2026. The two-year sequence is notable because it occurred through changing geopolitical headlines, a strong gold rally and a later sharp correction. By itself it demonstrates a persistent preference for increasing reported physical exposure rather than simply allowing price movements to alter the dollar value of existing reserves.
Monthly additions have varied substantially. October’s 25.8 tonnes compares with roughly 23 tonnes reported in September, and about 129 tonnes were added over the first ten months of 2026. A streak of positive monthly quantities does not tell readers the precise decision process or the scale of unofficial holdings outside the reported monetary reserve account.
The reserve total is about 2,435 tonnes—not the market-value figure
A numerical trap appears whenever reports mix ounces, tonnes and dollars. China’s 78.30 million fine troy ounces convert to around 2,435.4 metric tonnes; the monthly rise of 830,000 ounces converts to about 25.8 tonnes. The headline figures can be independently reconciled with standard metric conversion and do not require a speculative model.
The reported dollar value of the reserve, however, fell to roughly US$306.4 billion at the end of October from about US$323.5 billion at the end of September, even though more ounces were held. This is possible because the gold price used to mark holdings dropped. Holding more metal and reporting a lower value in US dollars are not contradictory.
Did Beijing buy the dip? The timing problem behind the story
The official statistics compare end-September with end-October stocks. They do not publish a daily trade ledger. China could have added metal at several prices throughout October, acquired it through different counterparties, or recognised inventory that had moved between eligible accounts. The public data is insufficient to show that officials specifically waited for the market’s lowest trading session.
For an accurate TradeLuma reading, use the phrase “reported a reserve increase in a month when gold fell nearly 7%,” not “bought 25.8 tonnes at the bottom.” The former is a documented contrast; the latter is a claim about execution timing that cannot be confirmed from the reserve release.
Why gold matters to a central bank in the first place
Gold is a reserve asset with no issuer credit risk when held outright in custody. It can diversify a reserve portfolio of government bonds, deposits and foreign currencies, and it can be mobilised through sales, swaps or collateral arrangements. Its role is not identical to that of liquid Treasury bills: it does not pay coupons, its market price can be volatile and storage, assurance and settlement have costs.
For large sovereign institutions, gold can also act as a politically distinct store of value in a world where payment channels, sanctions and international relations matter. Those benefits do not automatically make gold superior to dollars or Treasuries in every crisis. The trade-offs depend on market access, convertibility, liquidity requirements and what risks reserve managers are trying to reduce.
Is China deliberately reducing dependence on the US dollar?
Reserve diversification is a credible possible motive: increasing gold’s share can reduce concentration in dollar-denominated assets and may offer resilience if currency or sovereign-credit relationships change. But gold accumulation on its own does not tell us that China sold an equivalent quantity of US Treasuries, nor does it reveal a timetable to replace the dollar in international trade.
China still maintains substantial foreign-currency reserves. In October those reserves were reported near US$3.405 trillion, a scale far greater than the roughly US$306 billion value of reported gold holdings. A stronger analysis evaluates both components rather than treating an increase in bullion as proof of an imminent collapse in the global dollar system.
The World Gold Council’s 321 tonnes: don’t confuse estimates with disclosures
The World Gold Council reported that central banks and other official institutions bought an estimated net 321.2 tonnes of gold during the third quarter of 2026, the strongest quarterly reading since late 2024. That was 42% above the comparable quarter in 2025 and helped bring nine-month estimated demand to 675 tonnes. These figures encompass broader estimated demand rather than simply adding up public announcements.
Only about 120 tonnes of Q3 net purchases were disclosed at country level, according to the Council. China accounted for roughly 63 tonnes and Poland around 40 tonnes; together they represented most publicly reported buying. The difference between total estimated and reported activity is a useful reminder that global central-bank gold flows are not perfectly transparent.
China versus Poland: two central-bank buyers, different priorities
The People’s Bank of China and the National Bank of Poland were the largest identifiable buyers in the Council’s third-quarter data. China’s buying accelerated over the period, while Poland had purchased substantially more earlier in the year. Both show that gold accumulation is not a uniquely Chinese phenomenon or a definitive signal about a single country’s economic outlook.
Each central bank manages a different balance sheet, currency regime and security environment. Comparing tonnage without considering the size of overall reserves, domestic liabilities and policy mandates can mislead. A 25-tonne increase means something different to a large reserve issuer than to a much smaller monetary authority.
Could central-bank demand put a floor under falling gold prices?
Persistent physical buying can provide incremental demand and may cushion corrections, especially when speculative flows become one-sided. But a “floor” suggests a guaranteed price at which an institution will buy enough to stop losses, and no such public commitment exists. Market prices still depend on global investors, miners, exchange-traded funds, derivatives positioning, jewellery demand and the cost of financing.
The Council’s Q3 report also showed mixed private-sector demand: ETF investment was strong, while bar-and-coin and jewellery buying faced headwinds. This mixture makes simple claims—such as “China can prevent a gold crash”—too strong. Official buying may support the long-term demand base while gold continues to experience sharp drawdowns.
Why gold bounced above $4,100 on November 9
Gold recovered in early November as market attention shifted toward the US interest-rate path and oil-price developments. Reuters reported spot bullion around US$4,107 an ounce on November 9 and December gold futures settling near US$4,114.50. A softer dollar and lower crude prices helped ease inflation worries, even as Middle East shipping and geopolitical risks remained in view.
It is not possible to isolate China’s reserve disclosure as the single cause of the rebound. Currency moves, yields, changing Federal Reserve expectations, short covering and news from the US midterm elections all influenced the period. The useful market story is a multi-factor rally occurring alongside fresh evidence of official-sector demand.
The biggest near-term catalyst: October US CPI on November 10
US consumer-price data scheduled for Tuesday, November 10 is a near-term risk event for gold and Treasury yields. A higher-than-expected inflation reading could reinforce expectations of further Federal Reserve tightening, pushing real yields and the dollar higher and weighing on bullion. A softer surprise could do the reverse. The key variable for trading is the surprise relative to consensus, not simply whether the headline inflation number is positive.
At the time this analysis was prepared, the November 10 CPI result had not yet been released. Forecasts and futures-implied probabilities are mutable, so readers should consult the actual Bureau of Labor Statistics release and prevailing rates after publication. Do not portray any hypothetical gold response as if the data had already been published.
The paradox: gold as an inflation hedge versus gold as a rate-sensitive asset
Gold has a long-term reputation as protection against currency debasement and loss of purchasing power, but its short-term behavior often reflects changes in real interest rates. Because physical gold offers no yield, a rise in returns available on inflation-adjusted bonds can make it less attractive at the margin. Higher inflation can therefore coincide with falling gold if monetary-policy expectations tighten even faster.
Oil prices amplify the puzzle. A major energy-price shock can increase inflation anxiety but can also lift policy-rate expectations and government yields, putting pressure on bullion. Conversely, falling energy prices may reduce short-run inflation pressure and support gold if the market believes central banks can become less restrictive. This is why reserve buying and day-to-day gold prices need not move together.
What the US dollar, Treasury yields and RMB can reveal
The dollar is the international quotation currency for gold, so a weaker US dollar can make a given ounce cheaper in other currencies. Real yields matter because they proxy the opportunity cost of a non-interest-bearing asset. The Chinese yuan is relevant for local demand and reserve valuation, but a PBOC bullion increase does not mean every mainland buyer received the same price or access to international markets.
Traders should monitor the dollar index, US two-year and ten-year yields, inflation breakevens, currency basis and the timing of macro data. These are related variables, not a mechanical one-for-one trading formula. Physical demand may underpin gold over months while leveraged positioning dominates the next five-minute candle.
Three scenarios for XAU/USD, COMEX gold and micro gold futures
Bullish scenario: inflation surprises lower, the dollar and real yields ease, and gold holds its recovery above the psychologically important US$4,000 region. Central-bank diversification and ETF demand could support sentiment, but additional upside requires fresh buyers and persistent favorable macro conditions. This is a conditional pathway, not a price forecast.
Neutral scenario: supportive reserve news is offset by restrictive rate expectations, leaving gold volatile and rangebound. Bearish scenario: CPI or other data reinforces higher-for-longer interest rates, the dollar strengthens, and gold retests lower levels despite official-sector demand. No scenario carries a verified probability, and market liquidity can change abruptly around economic releases.
A practical checklist for gold traders after the PBOC release
Separate structural information from entry signals. Note the report date, the month-end gold quantity, the 25.8-tonne delta and the fact that execution timing is unknown. Then verify the latest spot or futures contract price, the correct expiry month, the bid–ask spread, contract specifications and the economic calendar before considering an order.
For CME Micro Gold (MGC), remember that futures leverage magnifies losses as well as gains, margin requirements can change and stop orders do not guarantee a particular fill during gaps. Avoid interpreting the TradeLuma article cover’s decorative chart as historical data. An educational macro thesis is not a substitute for a defined maximum-loss plan or suitability assessment.
What would change this gold-buying thesis?
The next PBOC reserve update will reveal whether the 24-month streak continues, stalls or reverses. The World Gold Council’s next demand review may clarify whether private ETF flows, bullion demand and estimated official purchases continue to offset weaker jewellery markets. For a stronger de-dollarisation argument, analysts would also need multi-quarter evidence about reserve composition, settlement currencies and policy actions—not only a monthly gold count.
Equally important is how prices respond if US inflation, geopolitical tensions or economic growth change. A persistent rise in real yields could make gold’s tactical outlook more difficult even while central banks keep accumulating. The sound conclusion is that China has increased reported reserves through a sell-off, not that it knows a secret future gold price.
Bottom line: a powerful reserve signal, not an insider gold-price forecast
China’s 25.8-tonne addition and 24 consecutive monthly reserve increases are significant, especially against a nearly 7% October decline. The reported total of 78.30 million troy ounces, approximately 2,435.4 tonnes, confirms substantial official interest in gold as a reserve asset. It does not prove that every ounce was bought at the market low or that Beijing has information other participants lack.
For readers watching gold, silver or MGC futures, the next tests involve inflation, interest rates, the dollar, investor flows and continued central-bank demand. Those are measurable forces worth tracking. The most useful lesson from the China story is to distinguish a long-term reserve allocation decision from a short-term directional trading signal.
Frequently asked questions
How much gold did China add in October 2026?+
China reported an increase of 830,000 fine troy ounces, equivalent to approximately 25.8 metric tonnes, from end-September to end-October 2026.
How much gold does China hold in total in October 2026?+
The reported official reserve was 78.30 million troy ounces, equal to roughly 2,435.4 tonnes at 31.1034768 grams per troy ounce.
Has China bought gold for 24 consecutive months?+
China reported month-on-month increases in official gold holdings for 24 consecutive months, from November 2024 through October 2026.
Did the PBOC buy 25.8 tonnes at October’s lowest gold price?+
The available official release provides only month-end reserve balances. It does not disclose individual execution dates, transaction prices or the market venue.
How much did gold fall in October 2026?+
International gold prices fell nearly 7% in October 2026, even as China reported a positive monthly gold-reserve change.
Why did the dollar value of China’s gold reserves fall while holdings rose?+
Physical gold holdings increased, but the market valuation of the existing reserve fell as the gold price declined. The two measures answer different questions.
How much gold did central banks buy in the third quarter of 2026?+
The World Gold Council estimated 321.2 tonnes of net official-sector buying in Q3 2026. About 120 tonnes were country-reported; the remainder was estimated.
Is China abandoning the US dollar because it is buying gold?+
Gold purchases can be consistent with reserve diversification, but they do not prove China is abandoning the dollar or reveal changes in every other reserve asset.
Did gold recover above $4,100 in November 2026?+
Reuters reported spot gold around US$4,107 per ounce on November 9, with US December futures settling near US$4,114.50. These are historical figures, not current quotes.
Will US CPI on November 10 push gold higher or lower?+
It depends on the release versus market expectations and how the dollar and real yields react. The result was not available when this November 10 article was prepared.
Does China buying gold guarantee that prices cannot fall?+
No. Official demand may help support the market over time, but rates, currencies, ETF flows, positioning and other factors can cause large declines.
What does the China gold story mean for Micro Gold futures (MGC)?+
It provides macro context but not a standalone entry signal. Traders should verify the relevant futures contract, leverage, margin, liquidity and economic-release risk before any trade.
Put it into practice
Use the risk maths next to the guide.
Open TradeLuma's free position-size, risk/reward, expectancy, and drawdown tools to test the numbers behind a risk-management decision.
Open free trading calculators →Continue learning
Related guides.

Oil Price Crash November 2026: Brent Below $100, Iran Peace Hopes and the Gold Trade
Brent oil plunged around 17% in the week ending Nov 6, 2026. Explore US–Iran diplomacy, Hormuz risk, WTI, gold, inflation and what oil traders should watch.

US CPI November 2026 Preview: Why October's Annual Inflation Data Are Missing—and What Gold and Nasdaq Traders Should Watch
US October 2026 CPI arrives 10 November. Learn why most annual CPI rates will be unavailable, what monthly inflation shows, and the implications for gold, Nasdaq and Fed rates.

Binance $6.3 Billion Hack: Why Bitcoin ETFs Lost $1 Billion and What It Means for BTC
Binance's $6.3B hack, Bitcoin ETF withdrawals above $1B and BTC near $75,600 shook crypto in November 2026. Learn the risks, facts and what to watch next.