
Futures
Open Interest vs Volume in Futures: How to Read Market Participation
Learn what futures open interest measures, how it differs from volume, what rising or falling OI means, and how rollover affects the data.
On this page+
Open interest and trading volume are two of the most useful—and frequently confused—statistics in futures markets. Volume counts how many contracts changed hands during a period. Open interest counts how many contracts remain outstanding after trading positions are opened and closed. Those numbers can rise, fall or diverge for perfectly normal reasons. This guide explains the calculation with concrete examples, examines price and open-interest combinations without treating them as trading signals, and shows why expiry, data publication times and contract mapping matter for reliable futures analysis.
Open interest vs volume: the quick answer
Futures volume is the number of contracts traded during a chosen period, such as one five-minute candle or an entire exchange trading session. Open interest is the number of outstanding futures contracts that have not yet been offset or otherwise closed, generally measured after the clearing process for a trading date. Volume describes activity; open interest describes positions still in existence.
The difference matters because a contract can trade repeatedly without increasing the number of open contracts. A session with very high volume can finish with unchanged or lower open interest. Traders who treat the two as interchangeable risk misreading both liquidity and apparent conviction.
What does open interest mean in futures trading?
Every outstanding futures contract has both a long side and a short side. Open interest counts that matched contract once, not twice. If a particular futures expiry shows 50,000 contracts of open interest, it implies 50,000 open long contract sides matched with 50,000 open short contract sides—not 100,000 separate open contracts.
Open interest does not tell you whether the next price move will be up or down. It is an inventory-like measure of contract commitments after trades have opened, transferred or closed positions. The number of traders, their motivations and their account-level leverage cannot be inferred directly from the headline total.
What does futures trading volume measure?
Volume counts matched contracts that changed hands during the reporting period. A trade of seven contracts contributes seven contracts to volume, not fourteen, because each matched contract involves one buyer and one seller. The same contract may be bought and sold many times in a session, adding to volume with each transaction.
Volume may appear on each intraday candle or as a cumulative session total. Be careful when comparing a 15-minute bar to a daily total: those are different windows. A large volume spike confirms activity, not necessarily buying pressure, new positions or a profitable breakout.
How open interest rises, falls or stays unchanged
When both counterparties open new positions, one long and one short, a matched contract increases open interest by one. When both counterparties close existing positions, open interest decreases by one. When a new participant takes over one side from a participant closing that side, the number of outstanding contracts is unchanged.
All three cases add one contract of trading volume. That is the defining difference: volume counts the transaction; open interest follows whether contracts were created, extinguished or transferred. Exchange clearing and reporting conventions matter, so this is a conceptual model rather than a way to identify an individual trader from public tape data.
Simple example: 100 open contracts and 40 contracts traded
Imagine a futures expiry begins with 100 contracts of open interest. During the day, 15 matched contracts are opened by both counterparties, 10 are closed by both counterparties, and 15 are transferred between opening and closing counterparties. Total volume is 40 contracts because 15 + 10 + 15 contracts traded.
Closing open interest is 105 contracts: 100 + 15 - 10. The 15 transfers do not alter the open total. This example shows why daily volume can be much larger than the day-over-day change in open interest, and why the change in open interest is not simply equal to daily volume.
Open interest compared with volume at a glance
Volume is a flow measure: how many contracts trade during a defined interval. Open interest is a stock measure: how many contracts remain outstanding at a stated reporting point. A fast-moving futures contract can record large intraday volume even when few traders hold positions after the session.
To compare them correctly, note the reporting time, the exact contract month, whether figures are preliminary or final, and whether the chart shows an exchange contract or a constructed continuous series. Use open interest to understand participation across days, and volume to see activity within the day or trading session.
Does rising open interest mean bullish buying?
No. Every newly created futures contract has a buyer and a seller. Rising open interest indicates that outstanding commitments increased; it does not reveal whether the new positions will ultimately support a rise or decline. A market can accumulate new short exposure while prices fall, or new long exposure while prices rise.
A useful interpretation combines price direction, volume, change in open interest, contract-month context and the economic event driving the market. Even then, the result is a hypothesis about participation—not proof of institutional accumulation, distribution or the identity of buyers and sellers.
Price rising and open interest rising
An upward price move accompanied by increasing open interest is often interpreted as additional positions entering while the move develops. It can be consistent with a trend attracting fresh participation, particularly when volume also improves and the change is sustained beyond one session.
It is not an automatic long signal. New shorts can also be opening into the same rise, and price can reverse despite expanding open interest. A trader still needs an independently defined setup, invalidation level and realistic transaction-cost assumptions.
Price rising and open interest falling
When price advances as open interest declines, one interpretation is that some existing positions are being closed while the market rises. In a falling market that then rallies, short covering is a plausible scenario: bearish positions are bought back, reducing outstanding contracts.
But the public open-interest number cannot establish who covered, why they traded or whether the rally will fail. A price rise with declining open interest is a context clue that may be tested against later returns, not a universal bearish divergence.
Price falling and open interest rising
A decline in price alongside increasing open interest can be consistent with new positions being established in a falling market. Some analysts associate this pattern with an increasingly well-participated downtrend, especially if turnover rises too.
The conclusion must remain conditional because every new short has a new long on the other side. Changes in hedging demand, contract roll activity and fundamental events can produce the same aggregate figures without predicting the next move.
Price falling and open interest falling
A price decline with contracting open interest can indicate that existing contracts are being reduced as the market falls. Long liquidation is one possible driver, although that description cannot be proved from aggregate open interest alone.
Some traders watch for exhaustion after persistent selling and shrinking positions, but neither a bounce nor a trend reversal is guaranteed. Compare the movement with prior sessions, volatility, expiry proximity and the actual order-book conditions before concluding that selling pressure is finished.
Four price and open-interest combinations: a practical interpretation
As a compact analytical framework: price up with open interest up can suggest expanding participation in the advance; price up with open interest down can suggest closing activity during an advance; price down with open interest up can suggest expanding participation in the decline; price down with open interest down can suggest position reduction during the decline.
These four labels are descriptive shortcuts rather than reliable entry rules. There is no directional information in open interest alone, and correlation with subsequent returns must be tested out of sample rather than assumed from a few textbook chart examples.
Can volume rise when open interest falls?
Yes. Imagine many market participants rapidly trading and closing positions before the end of the session. Each matched trade adds to volume, while matched closures decrease open interest. Another common scenario is a contract approaching expiry, when trades shift toward the next maturity while the old expiry sheds outstanding contracts.
For example, 100,000 contracts might trade in one day while open interest declines by 8,000. The two measures are not contradictory. They are describing different aspects of what happened during the session and at clearing.
Why open interest changes during futures rollover
Most standard futures contracts expire. As traders close the expiring contract and establish positions in a later month, open interest often decreases in the old expiry and increases in the next active expiry. That does not necessarily mean overall market participation or interest in the underlying commodity has collapsed.
For ES, NQ, GC, MGC, CL and similar products, compare contract-month open interest with relevant product totals and volume migration. Back-adjusted continuous charts can splice one month into another, so they are not automatically a valid single open-interest series unless the data vendor defines how the values are combined.
Daily open interest is usually not a live tick-by-tick indicator
For CME futures, official open-interest data is normally reported through cleared end-of-day statistics. Preliminary volume-and-open-interest reports can differ from the final Daily Bulletin. Some platforms show estimated or intraday open interest, particularly for other derivatives markets, but those displays should not be assumed equivalent to final exchange-cleared figures.
This delay is crucial for strategy design. Do not construct a backtest that uses a day’s final open interest to trigger trades earlier during that same session. Confirm the provider’s publication timestamp, update cadence, timezone, trade date and whether corrections are retroactively applied to the historical series.
Where to find futures open-interest data
A reliable starting point is the exchange’s own volume and open interest reports, including CME Group’s Daily Bulletin and product-level statistics. These allow traders to inspect specific expiries rather than relying only on a generic symbol or a third-party chart overlay.
Trading platforms may also offer historical OI charts, but coverage varies by exchange, contract and subscription. Verify whether the series is for an outright futures contract, options on futures, a continuous symbol, or an aggregate. Definitions and publication times matter more than the indicator’s visual style.
Open interest versus the CFTC Commitments of Traders report
Open interest is the aggregate number of outstanding contracts. The CFTC Commitments of Traders (COT) reports add a different layer: classifications and reportable positions of certain groups of market participants for eligible markets, subject to their reporting definitions and schedule.
COT cannot be reconstructed from a simple OI chart, and neither report lets you see every account’s intention or an instantaneous order-flow breakdown. For a practical research process, use OI for contract-level participation and COT only when the reporting categories and lag match the question being studied.
Can open interest confirm a breakout?
A trader might study whether a breakout accompanied by higher volume and a later increase in open interest has different subsequent behaviour from a breakout with weak volume and falling open interest. This is a testable research hypothesis, not a guarantee that the breakout will continue.
Write objective rules: breakout level, volume threshold relative to a comparable time of day, OI observation lag, stop, target, commission and slippage. A signal that uses tomorrow’s cleared OI to label today’s entry is look-ahead bias and should be rejected.
How to backtest open interest without common data errors
Use the actual contract-month series or a documented aggregation method, preserve publication timestamps, and align every observation with the point when it was available to the strategy. Segment results around rollover windows, holidays, settlement corrections and major scheduled events.
Compare an unchanged price-and-volume strategy with and without the open-interest filter. Measure expectancy, trade count, average trade, maximum drawdown, adverse and favourable excursion, slippage sensitivity and performance in out-of-sample periods. A useful OI filter should show stable value after those controls.
Using open interest in an automated futures workflow
An automation system can store the latest confirmed OI value with its source, contract identifier, exchange trade date, observation timestamp and update status. It can use the figure as a researched context filter if the data is current for the rule, while refusing to treat delayed data as live order-book information.
Keep contract selection, rollover mapping, position limits, stop-risk calculation and broker-order state separate from OI. A TradingView signal may reference a continuous chart, but a real order requires the approved tradable expiry. Open interest is information, not a substitute for the execution checks.
Common mistakes when reading futures open interest
Common errors include counting both the buyer and seller and thereby doubling outstanding contracts, mistaking high volume for new positions, treating rising OI as proof of bullish buying, comparing OI across mismatched contract months, or ignoring that provisional reports can be revised.
Another frequent mistake is assuming that open interest provides real-time information on the identity of institutional buyers or sellers. It does not. The most disciplined interpretation is specific to the market, exact expiry, reporting lag and a predefined analytical question.
A practical open-interest checklist
Before using OI, confirm the futures product, specific expiry, observed trade date, preliminary or final status, and whether the data is genuinely available at decision time. Pair it with price, volume, current spread, session liquidity and the rollover calendar.
Then decide what you want the measure to test: participation, contract-month migration, trend robustness or a liquidity condition. Track whether it actually improves a repeatable strategy rather than adding a persuasive story after the price move has already happened.
Frequently asked questions
What is open interest in futures trading?+
Open interest is the number of outstanding futures contracts that remain open for a contract or market at a stated reporting time. Each matched long and short contract is counted once, not twice.
What is the difference between volume and open interest?+
Volume measures contracts traded during a period; open interest measures contracts still outstanding after positions are opened, closed or transferred. A trade increases volume even when it does not change open interest.
Is rising open interest bullish or bearish?+
Neither by itself. Every new futures contract has both a buyer and seller. The change in outstanding positions must be interpreted with price action, market context and the reporting lag.
Does open interest increase when someone buys a futures contract?+
Not necessarily. Open interest increases only when a matched trade creates a new outstanding contract, with both counterparties opening positions. If one participant opens and the other closes, open interest stays unchanged.
Can open interest decrease while volume increases?+
Yes. Volume rises with every matched trade, while open interest falls when existing contracts are offset by closing counterparties. Both can happen on the same high-activity day.
Does high open interest mean a futures market is liquid?+
High open interest may be associated with broad participation, but it does not guarantee tight spreads, deep order books or good execution. Check current volume, spread and market depth for the precise contract.
Why does open interest drop before futures expiry?+
As expiration approaches, traders often close the expiring contract or roll exposure into a later month. Open interest may migrate between expiries without a comparable decline in total interest in the underlying market.
Is open interest available in real time?+
Official exchange-cleared futures open interest is commonly reported after the trading session, with preliminary and final updates. Some platforms offer estimates or alternative derivative-market series, so check the data source and timing.
Where can I see CME futures open interest?+
CME Group publishes volume and open-interest reports and its Daily Bulletin. Trading platforms may also display OI for particular products and contract months, subject to data coverage and permissions.
Is open interest the same as the number of traders?+
No. One trader may hold many contracts, while open interest counts outstanding matched contracts. The OI total does not reveal how many accounts participate or their identities.
What does price rising with falling open interest mean?+
It can be consistent with positions closing during an upward move, including possible short covering, but aggregate open interest does not prove which group exited or predict the next price move.
Can you use open interest to predict futures prices?+
Open interest can support research into market participation and trend conditions, but it is not a reliable standalone predictor. Test any proposed filter on properly time-aligned data and account for costs and rollover.
Is open interest the same as COT positioning?+
No. Open interest is the aggregate number of outstanding contracts; the CFTC Commitments of Traders report provides separate, delayed classifications of reportable positions in eligible markets.
How does a continuous futures chart affect open-interest data?+
A continuous chart joins successive contract months. Its OI series may represent one selected expiry or an aggregation, depending on the provider; confirm the definition before comparing across rollover dates.
Futures workflows
Explore the strategy side of TradeLuma.
Browse TradeLuma's futures strategy catalogue and the chart, rollover, and reference methodology used for each published strategy.
Explore futures strategies →Continue learning
Related guides.

Futures Trading Hours: CME Globex, RTH, Overnight Sessions & Daily Breaks (2026 Guide)
Learn when futures markets open and close, including CME Globex hours for ES, MES, NQ, MNQ, Gold and Crude Oil, plus RTH, overnight sessions, breaks and time zones.
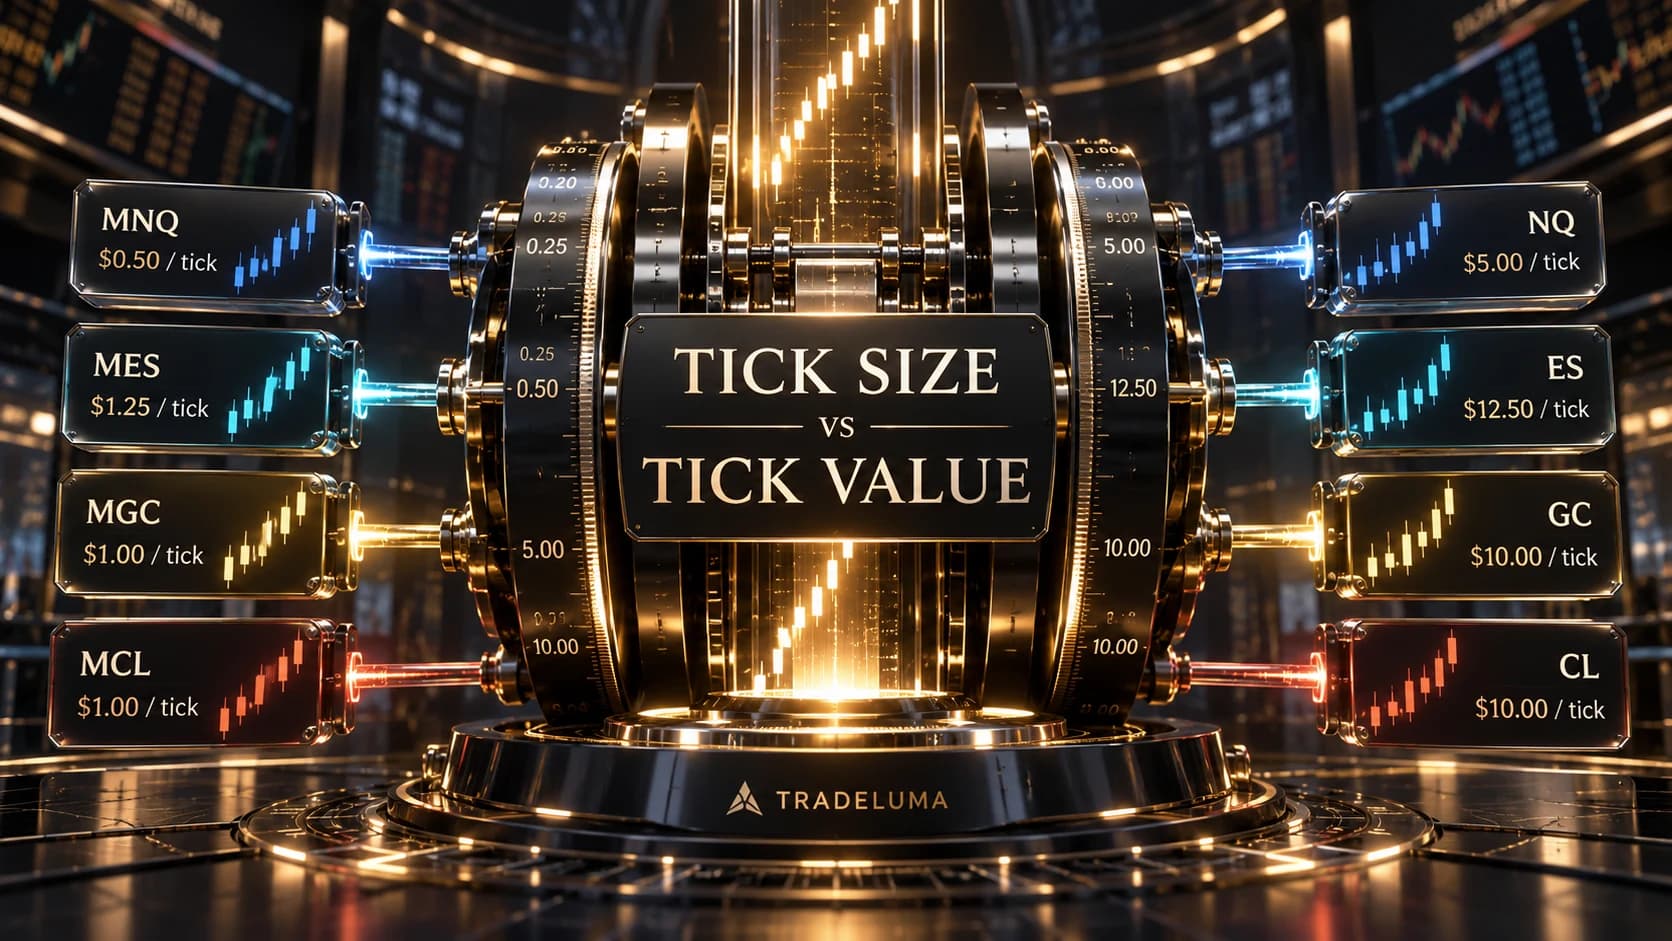
Tick Size vs Tick Value in Futures: ES, NQ, MES, MNQ, Gold & More
Learn the difference between futures tick size and tick value, with current ES, NQ, MES, MNQ, Gold, Micro Gold, WTI and Micro WTI examples.

1-Ounce Gold Futures vs Micro Gold (MGC) vs Gold (GC): 2026 Guide
Compare 1-Ounce Gold (1OZ), Micro Gold (MGC) and Gold (GC) futures by contract size, tick value, trading hours, settlement, expiry and risk.