
Futures
Micro E-mini Futures Explained: MES vs MNQ vs MYM vs M2K
Compare MES, MNQ, MYM and M2K Micro E-mini futures by index, multiplier, tick value, trading hours, expiry, settlement and risk.
On this page+
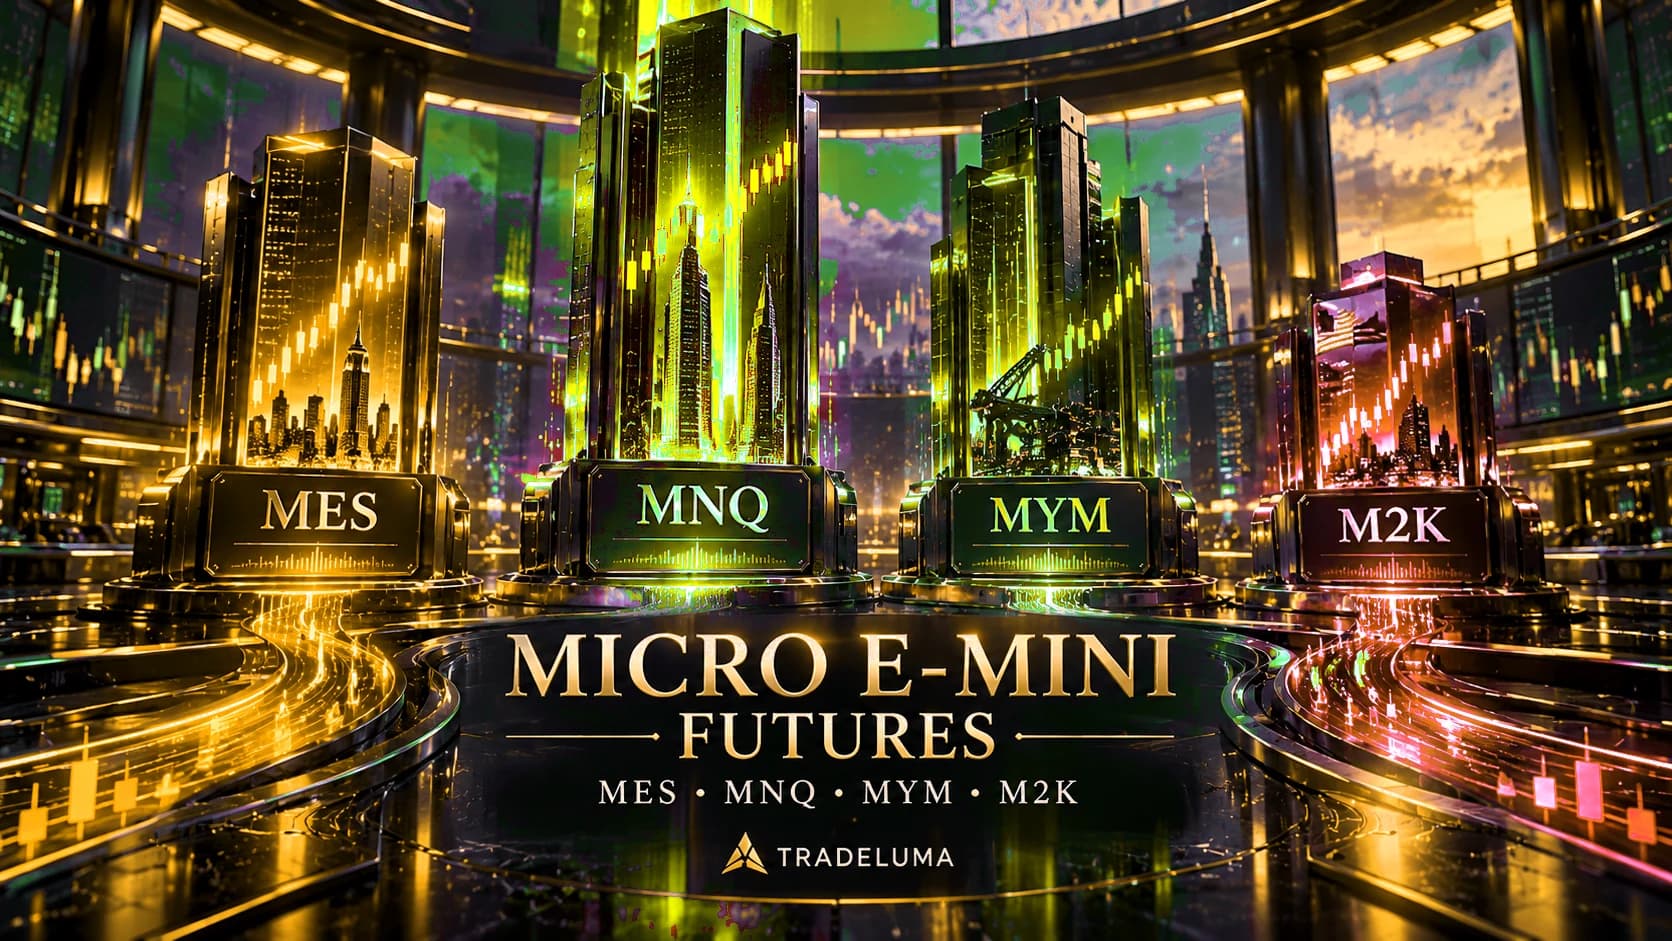
Micro E-mini futures give traders smaller-sized exposure to four major US equity indexes: the S&P 500, Nasdaq-100, Dow Jones Industrial Average and Russell 2000. The core contracts are MES, MNQ, MYM and M2K. Each is one tenth the size of its corresponding E-mini contract, but the products do not share the same point value or tick size. This guide compares the four Micro E-minis, explains their 23-hour trading schedule, quarterly expiries and cash settlement, and shows why choosing between MES, MNQ, MYM and M2K should be based on the index, contract multiplier, volatility, liquidity and strategy rather than simply picking the smallest margin requirement.
What are Micro E-mini futures?
Micro E-mini Equity Index futures are smaller versions of CME Group's established E-mini index futures. The main four contracts are MES for the S&P 500, MNQ for the Nasdaq-100, MYM for the Dow Jones Industrial Average and M2K for the Russell 2000.
Each Micro E-mini uses one tenth the contract multiplier of its E-mini counterpart. That smaller unit lets traders adjust exposure in finer increments, but the contract is still a leveraged futures position whose profit and loss move with the underlying index.
MES vs MNQ vs MYM vs M2K at a glance
MES is $5 times the S&P 500 Index and uses a 0.25-point outright tick worth $1.25. MNQ is $2 times the Nasdaq-100 and uses a 0.25-point tick worth $0.50. MYM is $0.50 times the Dow Jones Industrial Average and uses a one-point tick worth $0.50. M2K is $5 times the Russell 2000 and uses a 0.10-point tick worth $0.50.
The dollar value per point matters as much as the tick. A 10-point move is approximately $50 in MES, $20 in MNQ, $5 in MYM and $50 in M2K per contract before costs. Because the indexes themselves trade at very different numerical levels and exhibit different volatility, point comparisons alone do not indicate which contract is safer.
MES: Micro E-mini S&P 500 futures
MES tracks the S&P 500, a broad large-cap US equity benchmark. Its multiplier is $5 per index point, one tenth of the $50-per-point ES multiplier. The 0.25-point minimum outright increment makes one MES tick worth $1.25.
MES is often used when a strategy wants broad US large-cap exposure with smaller position increments than ES. A 20-point move changes one MES contract by about $100 before commissions and slippage.
MNQ: Micro E-mini Nasdaq-100 futures
MNQ tracks the Nasdaq-100, which contains 100 major non-financial companies listed on Nasdaq and has substantial exposure to technology and growth-oriented businesses. Its contract multiplier is $2 per index point, one tenth of NQ's $20-per-point multiplier.
MNQ trades in 0.25-point outright increments, giving a $0.50 tick value. A 50-point Nasdaq-100 move changes one MNQ contract by about $100 before costs. The smaller dollar multiplier does not mean the index itself moves slowly; Nasdaq-100 intraday ranges can be large.
MYM: Micro E-mini Dow futures
MYM tracks the Dow Jones Industrial Average. It uses a $0.50-per-point multiplier, compared with $5 per point for the larger YM contract. The minimum outright increment is one Dow point, so one MYM tick is worth $0.50.
Because the Dow is price weighted and quoted at a much higher numerical index level than the S&P 500 or Russell 2000, traders should compare dollar risk rather than assuming a given number of index points means the same thing across products.
M2K: Micro E-mini Russell 2000 futures
M2K tracks the Russell 2000 small-cap index. Its multiplier is $5 per index point, one tenth of the $50-per-point RTY multiplier. The minimum outright tick is 0.10 index points, worth $0.50 per contract.
M2K can behave differently from large-cap indexes because its underlying companies are smaller and often more sensitive to domestic growth, financing conditions and changes in risk appetite. A strategy tested on MES or MNQ should not be assumed to have the same behaviour on M2K.
Micro E-mini contract multipliers explained
The multiplier converts an index move into contract P&L. MES and M2K are $5 per point, MNQ is $2 per point and MYM is $0.50 per point. To estimate gross P&L, multiply the index-point move by the contract multiplier and the number of contracts.
For example, if MNQ moves 75 points, the gross change is 75 × $2 = $150 per contract. If MES moves 30 points, the gross change is 30 × $5 = $150 per contract. Different point moves can therefore create the same dollar outcome.
Micro E-mini tick sizes and tick values
MES and MNQ both trade in 0.25-point outright increments, but MES has a $1.25 tick and MNQ a $0.50 tick because their multipliers differ. MYM trades in one-point increments worth $0.50. M2K trades in 0.10-point increments worth $0.50.
Order prices should be aligned to the correct tick grid. A strategy that hard-codes a 0.25 increment for every Micro E-mini would be wrong for MYM and M2K. The execution layer should use product-specific contract metadata.
Micro E-mini vs E-mini: the 1-to-10 relationship
The Micro E-mini multiplier is one tenth of the corresponding E-mini multiplier. Ten MES contracts have the same index-point multiplier as one ES; ten MNQ equal one NQ on multiplier; ten MYM equal one YM; and ten M2K equal one RTY.
That relationship is useful for understanding scale, but ten smaller contracts are not operationally identical to one larger contract. They can create more individual order units, different commission totals, different queue behaviour and different margin treatment at the broker.
Micro E-mini vs E-nano in 2026
CME added E-nano Equity Index futures in August 2026, creating another contract size below Micro E-mini. E-nanos are one tenth the Micro multiplier and one hundredth the corresponding E-mini multiplier. The family now offers E-mini, Micro E-mini and E-nano sizes for the major US equity indexes.
Smaller size increases position-sizing precision but should not be confused with lower market risk in percentage terms. Traders should compare liquidity, spread, broker availability, fees and the strategy's tested execution assumptions before moving between contract families.
What are Micro E-mini trading hours?
Micro E-mini Equity Index futures are designed for nearly 23-hour access on CME Globex. CME lists trading from Sunday 6:00 p.m. to Friday 5:00 p.m. Eastern Time, corresponding to Sunday 5:00 p.m. through Friday 4:00 p.m. Central Time, with the exchange's daily maintenance period.
Nearly around-the-clock trading does not mean liquidity is identical at every hour. Activity often changes around the US cash open, economic releases, overnight sessions and maintenance boundaries. Session filters should therefore be tested rather than assumed.
Expiry months and final settlement
Micro E-mini futures use the customary quarterly cycle of March, June, September and December. CME lists multiple concurrent contract months, and trading interest usually migrates toward the next active quarter as expiry approaches.
The contracts are financially settled rather than physically delivered. Final settlement uses the Special Opening Quotation of the corresponding underlying index on the third Friday of the contract month. Traders still need an explicit rollover plan because positions do not become perpetual simply because settlement is cash based.
MES vs MNQ: which is more volatile?
Nasdaq-100 and S&P 500 futures often have different intraday behaviour because the underlying indexes have different sector weights and constituent structures. MNQ can cover a larger number of index points during active technology-led sessions, while MES often reflects a broader cross-section of large-cap US equities.
Volatility should be measured in dollars relative to the chosen stop and contract multiplier rather than judged from the raw number of points on the chart. A wider MNQ point range can still be sized to the same planned cash risk as an MES trade if quantity and stop distance are adjusted correctly.
Margins are not the same as maximum risk
Futures margin is collateral required to hold a leveraged position. It can change with volatility, exchange requirements and broker policy, and intraday broker margins can differ from overnight requirements. The displayed margin is not a guaranteed maximum loss.
A risk plan should begin with price invalidation and dollar exposure. Calculate the stop distance using the contract's multiplier or tick value, then confirm that the account has sufficient margin and free-equity buffer. Sizing only from the maximum quantity a broker permits can create excessive risk.
How to position-size MES, MNQ, MYM and M2K
Choose the cash amount the strategy is allowed to risk, determine the technical stop distance, convert that distance into dollars per contract, and divide the risk budget by the per-contract risk. Round down to a whole number of contracts and include estimated costs.
For example, an MNQ stop 40 points away represents approximately $80 of price risk per contract because MNQ is $2 per point. An MES stop 16 points away also represents approximately $80 per contract because MES is $5 per point. The point distances differ, but the account-level risk can be matched.
Liquidity, spread and execution quality
The contract specification tells you the minimum tick and multiplier, but it does not tell you what fill you will receive. Bid-ask spread, order-book depth, volatility and time of day affect execution. A market order can move through multiple price levels during fast conditions.
When comparing Micro products, review the exact expiry's live volume and spread at the hours your strategy trades. A smaller contract can improve sizing precision while still producing worse net results if the strategy trades when liquidity is thin or targets only a few ticks.
Continuous symbols vs the actual tradable contract
Charting platforms often use continuous symbols such as MES1! or MNQ1! for analysis. Those symbols combine multiple expiries into one historical series. A broker order, however, must target an actual contract month such as the current March, June, September or December future.
Automation should map the chart signal to the correct broker contract, preserve the expiry identifier on open positions and change new-entry mapping deliberately during rollover. A continuous chart should never be treated as the broker contract itself.
Which Micro E-mini fits which market view?
MES provides broad S&P 500 exposure, MNQ targets the Nasdaq-100, MYM tracks the 30-stock Dow and M2K tracks US small caps through the Russell 2000. The choice is therefore fundamentally a choice of underlying index exposure before it is a choice of tick value.
There is no universally best Micro E-mini. A suitable contract is one whose underlying market matches the strategy, whose liquidity is adequate during the trading window, whose stop can be sized within the account's risk limits and whose broker mapping has been tested.
Common Micro E-mini mistakes
Common errors include assuming all four contracts have the same tick size, copying point-based stops between indexes without converting to dollars, treating broker margin as maximum loss, using a continuous symbol as an execution contract and forgetting to roll before expiry.
Another mistake is assuming Micro means low risk. A trader can always increase quantity until the exposure becomes large. Smaller contract units improve control only when the quantity is tied to a defined account-level risk rule.
A practical Micro E-mini checklist
Before enabling a trade, confirm the underlying index, product code, contract month, multiplier, tick size, tick value, trading session, current liquidity, broker permissions, margin requirement, stop distance and total quantity. Then calculate the maximum planned cash loss before costs and add a realistic allowance for fees and slippage.
For automated trading, confirm that the continuous chart symbol maps to the correct expiry and that rollover, session filters, duplicate protection and account-wide exposure limits all recognise the exact Micro E-mini contract being submitted.
Frequently asked questions
What are the four main Micro E-mini futures?+
They are MES for the S&P 500, MNQ for the Nasdaq-100, MYM for the Dow Jones Industrial Average and M2K for the Russell 2000.
How much is one MES point worth?+
MES has a $5-per-index-point multiplier. Its 0.25-point minimum outright tick is worth $1.25 per contract.
How much is one MNQ point worth?+
MNQ has a $2-per-index-point multiplier. Its 0.25-point minimum outright tick is worth $0.50 per contract.
How much is one MYM point worth?+
MYM has a $0.50-per-point multiplier and a one-point minimum outright tick, so one tick is worth $0.50 per contract.
How much is one M2K point worth?+
M2K has a $5-per-index-point multiplier. Its 0.10-point minimum outright tick is worth $0.50 per contract.
Are Micro E-mini futures one tenth the size of E-minis?+
Yes. Their contract multipliers are one tenth of the corresponding E-mini multipliers, although execution costs and order handling are not necessarily identical.
What hours do Micro E-mini futures trade?+
CME lists them from Sunday 6:00 p.m. to Friday 5:00 p.m. Eastern Time, or Sunday 5:00 p.m. to Friday 4:00 p.m. Central Time, with the exchange's daily maintenance period.
Are Micro E-mini futures cash settled?+
Yes. They are financially settled to the corresponding index's final Special Opening Quotation rather than delivering shares.
When do Micro E-mini futures expire?+
They use the March, June, September and December quarterly cycle, with final settlement on the third Friday of the contract month.
What is the difference between Micro E-mini and E-nano futures?+
E-nano Equity Index futures are one tenth the multiplier of Micro E-minis and one hundredth the multiplier of E-minis, providing an even smaller unit of index exposure.
Is MES or MNQ better for beginners?+
Neither is universally better. MES and MNQ track different indexes and have different volatility and point values. The appropriate contract depends on the strategy, stop distance, liquidity, costs and account risk limit.
Futures workflows
Explore the strategy side of TradeLuma.
Browse TradeLuma's futures strategy catalogue and the chart, rollover, and reference methodology used for each published strategy.
Explore futures strategies →Continue learning
Related guides.
1-Ounce Gold Futures vs Micro Gold (MGC) vs Gold (GC): 2026 Guide
Compare 1-Ounce Gold (1OZ), Micro Gold (MGC) and Gold (GC) futures by contract size, tick value, trading hours, settlement, expiry and risk.

E-Nano Futures vs Micro E-mini: NNQ vs MNQ vs NQ (2026 Guide)
Compare E-nano, Micro E-mini and E-mini equity index futures, including NNQ vs MNQ vs NQ contract size, tick value, trading hours, settlement and risk.
Tick Size vs Tick Value in Futures: ES, NQ, MES, MNQ, Gold & More
Learn the difference between futures tick size and tick value, with current ES, NQ, MES, MNQ, Gold, Micro Gold, WTI and Micro WTI examples.