
Futures
Futures Fair Value Explained: ES vs SPX, Basis & Cost of Carry
Learn why ES and SPX differ, how to calculate futures fair value and basis, and how financing, expected dividends and expiry affect index-futures prices.
On this page+
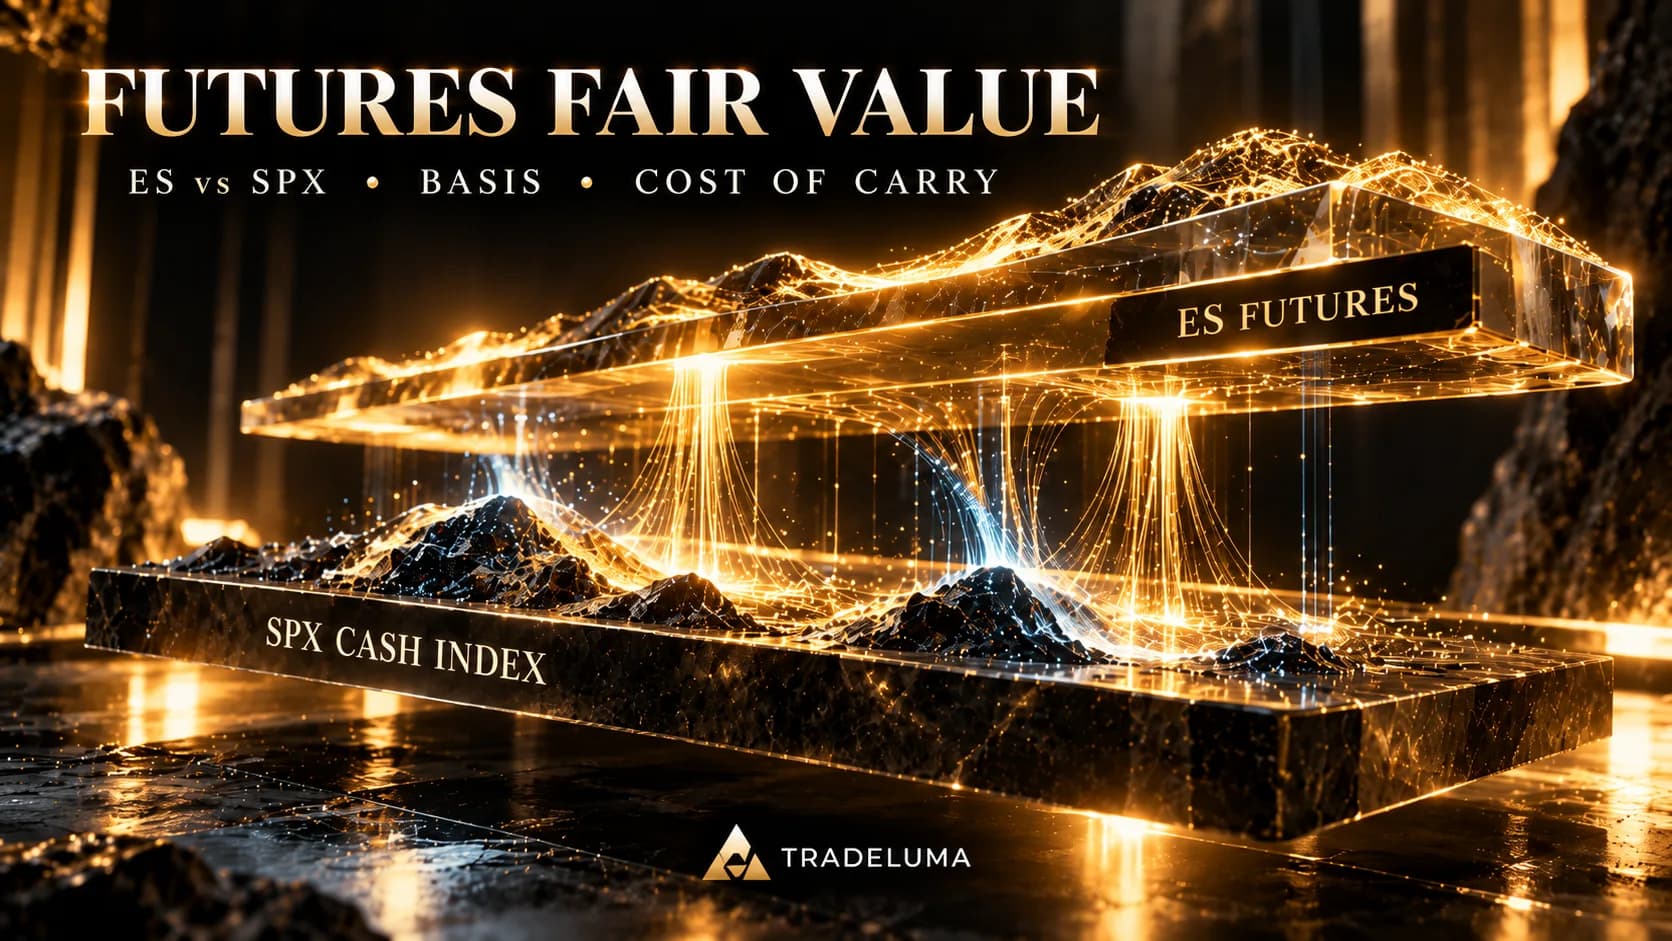
Why are S&P 500 futures (ES) often quoted at a different number from the S&P 500 cash index (SPX)? The answer is usually not a pricing mistake. Financing the underlying shares, expected dividends and the time remaining until contract expiry help determine a theoretical fair value for each futures maturity. In practice, the traded ES price can fluctuate around that benchmark because futures have their own order book, liquidity and market hours. This guide explains futures basis, gives a worked ES-versus-SPX fair-value example, distinguishes the raw premium from true model mispricing, and shows how to avoid common chart and backtest errors.
Futures fair value: the short answer
Index futures are commonly quoted above or below the level of the underlying cash index. That difference is not automatically an anomaly. The theoretical futures price accounts primarily for the financing cost of holding the underlying share basket until expiry and the dividends expected to be paid during that period. The observed ES market price can still depart from that theoretical estimate as buyers and sellers transact.
For the S&P 500, compare the E-mini S&P 500 futures contract (ES) with the cash S&P 500 index (SPX) using the same timestamp, a specific ES expiry and a consistent index value. The relevant questions are what futures currently trade at, what a realistic cost-of-carry model implies, and how large the residual difference is after known assumptions.
What is the difference between ES futures and SPX?
SPX is the published level of the S&P 500 cash index, a calculated measure of a basket of US-listed shares. ES is a standardised futures contract referencing that index, with a specific maturity, market price and exchange rules. SPX itself is not a security you can deliver by placing a trade in the displayed index number.
ES trades in an active futures order book, including hours when many underlying US shares are not trading in their regular cash session. Therefore an overnight ES quotation and a stale cash-index closing level should never be treated as simultaneous prices. MES, the Micro E-mini S&P 500 contract, reflects the same broad pricing economics at a smaller contract multiplier.
The basis formula: futures price minus spot index
A common index-futures basis convention is: basis = futures market price - cash index level. Suppose ES is 6,037 and SPX is 6,000 at the same instant. The quoted basis is +37 index points. If ES is 5,990 while SPX is 6,000, the basis is -10 points. Both figures describe a price difference; neither by itself establishes whether futures are mispriced.
Be explicit about the sign convention. Certain data services or markets define basis as spot minus futures, which reverses its sign. A comparison is only meaningful when the source, index, contract expiry, data timing and calculation convention are documented.
The fair-value formula for equity-index futures
A useful simplified model is: theoretical futures price approximately equals spot index + financing cost to expiry - expected index dividends to expiry. In symbols: F ≈ S × [1 + r × T] - D, where S is the cash index, r is an appropriate annual financing rate, T is the fraction of a year until expiry, and D is the expected dividends expressed in index points over the same period.
An alternative continuous-yield approximation is F ≈ S × exp[(r - q) × T], where q is the expected annual dividend yield. These approximations can differ slightly from a live fair-value model because actual funding terms, the precise timing of discrete dividends, calendars, rate curves and execution costs matter. State the day-count convention instead of assuming every source uses the same one.
Worked ES/SPX example: calculating theoretical fair value
Consider an entirely illustrative example: SPX = 6,000; annualised financing rate = 4%; expected annual dividend yield = 1.5%; and 90 days until expiry. Under a simple 365-day approximation, net carry is 2.5% × (90/365), so theoretical ES fair value is approximately 6,036.99 index points. The financing contribution is about 59.18 points and the dividend offset about 22.19 points.
If the actual ES quote at the same timestamp were 6,041, it would be about 4.01 points above that simplified theoretical benchmark. The 6,000, 6,041 and rate inputs are teaching examples—not current quotes, trading signals or evidence of a risk-free arbitrage. Real calculation needs the correct contract month, financing assumptions, forward dividends and transaction costs.
Why interest rates can put futures above spot
A fully funded purchase of the index share basket ties up capital, whereas a futures position normally requires performance-bond margin rather than payment of the whole index notional at entry. Financing and investment opportunities therefore affect the relative forward price. All else equal, higher financing rates raise the theoretical value of equity-index futures.
The formula does not mean that the quoted margin percentage is the interest rate or that cash left in a futures account automatically earns a specific rate. Financing assumptions refer to the economic cost of carrying the underlying exposure, and an individual trader’s interest on cash or margin facilities may be different.
Why expected dividends can put futures below spot
An investor holding the physical basket of index shares generally receives relevant cash dividends, while a buyer of a conventional price-index futures contract does not separately receive those underlying dividends. Expected dividends reduce the theoretical futures price relative to an otherwise identical no-dividend forward.
If expected dividend income over the remaining term exceeds financing cost, a futures contract can have a negative theoretical basis and still be correctly priced. This is why a discount to spot is not automatically bearish and a premium is not automatically bullish.
What is net basis, or mispricing relative to fair value?
Raw basis and net basis answer different questions. Raw basis is F_market - S_cash. One common definition of net basis is F_market - F_theoretical. In the worked example, raw basis is +41 points but net basis is only about +4.01 points. The second measure compares observed futures pricing with a specific model rather than assuming zero basis is fair.
Be careful with software labels such as premium, discount, fair-value spread or implied basis. Some feeds show cash minus futures, some show futures minus cash, and others compare futures with an estimated dividend-adjusted theoretical price. Read the provider’s definition before combining series.
Why ES and SPX prices are not equal throughout the day
Before expiry, financing and dividends create a legitimate basis. In addition, ES trades in its own limit-order book and responds continuously to expectations about the US stock market. Differences in timestamp, reference price, price precision, data-feed delay and exchange trading hours can make screenshots look far more divergent than simultaneous values are.
A common mistake is to compare a live Sunday-evening ES quote with Friday’s official SPX cash close. That weekend gap can reflect subsequent news and global markets, not a suddenly huge fair-value discrepancy. Match observations carefully and treat after-hours SPX values as potentially stale.
Why futures and cash tend to converge around expiry
For many standard cash-settled index futures, settlement is ultimately tied to an official underlying-index reference calculation. The remaining financing period and foregone dividends shrink toward zero as expiry approaches, so the theoretical basis tends to contract. Arbitrage and hedging activity also help link the futures and underlying markets.
Convergence is not a guarantee that every intraday displayed quote will equal the last published spot index point. The final settlement method, settlement window and price-source timestamps can differ from the latest visible screen quote. Use the exact contract’s settlement procedures.
ES versus MES: same basis, different dollar exposure
ES and MES reference the S&P 500 with matching broad index-futures economics, so the fair-value relationship to SPX is conceptually the same. Their multipliers differ: standard ES represents $50 per index point, while MES represents $5 per point. A theoretical four-point premium is therefore not a $4 risk amount or profit amount on either contract.
For a one-contract example, a four-point change corresponds to $200 in ES or $20 in MES before trading costs. That calculation measures contractual point exposure; it does not represent a guaranteed return from any basis trade. Bid-ask spreads, financing, correlation and hedge sizing still matter.
NQ versus NDX and other equity-index futures
The same general finance-minus-dividends framework applies to Nasdaq-100 futures (NQ) relative to the Nasdaq-100 cash index (NDX), and broadly to other equity-index futures with relevant adjustments. The number of index points in a normal basis depends on the index level, financing environment, dividend expectations and maturity—not just which futures ticker is used.
Never directly compare ES index points with NQ index points as if they were commensurate dollars or percentage discrepancies. An index-level percentage, matching expiry model or contract-specific point multiplier is needed to compare economic exposure across different indexes.
How the futures basis changes with time to expiry
With other assumptions unchanged, more time to expiry usually means a larger financing and dividend adjustment because the underlying capital and expected income accrue over a longer horizon. As the same contract approaches expiry, the remaining theoretical adjustment normally becomes smaller.
If a trader switches from the expiring front-month ES contract to a later quarterly expiry, the quoted futures-versus-SPX difference can jump without the cash index itself moving. That is a different maturity, not a sudden breakdown in index tracking. Record which expiry is used in every historical comparison.
Futures fair value versus contango and backwardation
Fair value in this article asks how a particular index futures expiry relates to the current spot or cash index. Contango and backwardation instead describe the relative prices of different futures delivery months for a given underlying. These ideas connect through carry but are not the same chart or calculation.
For example, two ES expiries can both stand above SPX while the farther expiry has a higher price; that would be an upward-sloping futures term structure. A spot-relative premium should not be mislabelled a calendar spread, and a calendar spread should not be presented as an index-futures cash basis.
Fair value is theoretical, not the market mid-price
Fair value is an output of assumptions. The actual ES bid and ask come from submitted orders, changing liquidity and supply and demand. Around data releases or the US equity-market open, a live quote can briefly move away from a model estimate as market participants react to information.
Theoretical mispricing is not automatically tradable. A seemingly attractive spread may be smaller than the costs of financing, stock-basket execution, futures spreads, market impact, borrowing, taxes and operational risk. Even professional arbitrage desks model multiple sources of uncertainty.
How index arbitrage can connect ES and SPX
When futures become expensive relative to a replicable share basket, some participants may sell futures and buy the underlying shares; when futures become cheap, a suitable reverse transaction may be considered. This relationship can help anchor futures prices to the economics of their underlying indexes.
Actual implementation is complex. SPX itself cannot be bought as one share, and a fund or basket used as a proxy may have tracking error, fees, financing constraints and execution risk. Describing an expensive futures contract as an arbitrage opportunity does not establish that a retail trader can capture it safely.
The cash index is not an ETF price
SPX is an index level. SPY is an exchange-traded fund whose share price is roughly a fraction of the index level and reflects the ETF’s own mechanics. Mixing unadjusted ES index points with SPY share dollars creates an invalid basis calculation.
Trading an ETF instead of the exact cash basket also introduces ETF distributions, expense ratio, tracking and financing considerations. If an analysis uses an ETF as a proxy, normalise units and describe the limitations explicitly.
Beware of overnight and weekend index-value comparisons
ES and MES often trade during hours when the underlying US share market is closed. The widely quoted SPX cash-index level may remain unchanged until the next official calculation period, while futures continue incorporating new information. This is especially relevant across Sunday reopenings and major overnight macroeconomic developments.
An apparent large overnight ES-SPX gap is not by itself a measure of fair-value mispricing. Use a contemporaneous executable or modelled underlying reference, or clearly state that the analysis is comparing a live futures level with an earlier cash close.
How dividends and interest-rate announcements change fair value
Changes to the expected interest-rate path can affect theoretical carrying cost, particularly for expiries farther away. Changes to forecasts for index-dividend payments can also affect the implied futures premium or discount. A rate cut need not lower the live futures outright price, because the cash index can move for many simultaneous reasons.
Keep the variables separate: the futures contract price may rise at the same time its theoretical basis narrows, or fall while the theoretical basis widens. A model comparison should use updated expectations rather than the last published annual yield blindly.
A practical checklist for comparing ES with SPX
First identify the exact ES expiry and timestamp. Second obtain a contemporaneous SPX index value or mark stale cash closes clearly. Third estimate financing using an appropriate rate for the remaining term. Fourth estimate index dividends to that expiry. Fifth calculate theoretical futures value, raw basis and net basis consistently.
Finally compare the resulting difference with bid-ask spreads, estimated hedge and financing costs, liquidity, taxes where relevant, and the exact settlement definition. Repeat the calculation at multiple times before concluding a persistent premium or discount exists.
How to interpret a positive ES-SPX basis
A positive raw basis means the chosen ES futures quote exceeds the contemporaneous SPX cash index level. This can be entirely normal when financing cost dominates expected dividends over the remaining contract term. It is not a directional forecast on its own.
Only after estimating a defensible theoretical fair value can the analyst discuss whether the futures quote appears expensive or cheap relative to the model. Even then the distinction is a valuation observation, not a validated trade signal.
How to interpret a negative ES-SPX basis
A negative raw basis means the ES quote is below the cash index level using the stated sign convention. Dividends above financing can support a negative theoretical basis; market stress, demand for hedges or short-term liquidity may also affect actual pricing.
Do not assume negative basis means the index will decline or that the contract must bounce. What matters is how actual futures price relates to an appropriately updated theoretical benchmark and the conditions under which the difference can plausibly converge.
Fair value in backtests and TradingView charts
A continuous ES1! chart stitches individual futures expiries into a long time series. Depending on the platform, continuous data may include roll adjustment, back adjustment or other stitching conventions. A synthetic adjusted historical price is not identical to a price that could be traded at that moment.
To backtest cash-futures basis properly, use the actual unadjusted tradable expiry, synchronised cash-index observations, documented financing and dividend inputs and an explicit rollover rule. Do not calculate precise historical arbitrage signals by subtracting SPX from a back-adjusted ES1! series.
Fair value and risk controls in automated futures trading
An automated strategy that uses futures-versus-spot divergence needs a reliable timestamp and price-source policy, expiry-aware contract mapping, a model version and monitoring for stale underlying data. It should reject comparisons between a live futures tick and an old cash-index close unless that behaviour is deliberate and separately tested.
For a TradeLuma-style signal-routing workflow, the execution layer should continue applying margin, contract quantity, daily-loss and connectivity controls independently of any fair-value indicator. Fair value is contextual research; it does not remove slippage, latency, order rejects or model risk.
Final takeaway: distinguish price difference from mispricing
ES and SPX differ because a futures contract represents exposure across time while the cash index reflects a present index level. The raw difference is called basis; theoretical fair value adjusts cash for financing and expected dividends, and the residual after that adjustment can be described as net basis or apparent mispricing under an explicit convention.
Compare like with like: same index, compatible timestamps, named contract expiry and documented carry assumptions. A positive or negative basis alone is not a buy or sell signal, and a theoretical gap is not a promise of risk-free profit.
Frequently asked questions
What is futures fair value?+
Futures fair value is a theoretical estimate of a contract price based on the cash index level and the economic costs and benefits of carrying that exposure until expiry, particularly financing and expected dividends for equity indexes.
Why is ES higher than SPX?+
ES can trade above SPX when the financing-cost component exceeds expected dividends over the remaining time to expiry. Simultaneous quotes and actual contract expiry must be used before interpreting the difference.
Why is ES below SPX?+
When expected dividends exceed financing over the remaining term, theoretical equity-index futures can trade below the cash index. Actual order flow and timing can also affect the observed basis.
How do you calculate ES futures basis?+
Under the futures-minus-cash convention, basis equals the ES market quote for a specified expiry minus the simultaneously observed SPX index level. Check the data provider’s sign convention.
How do you calculate index futures fair value?+
A simplified formula is theoretical futures price ≈ cash index × (1 + annual financing rate × years to expiry) - expected dividends in index points to expiry. More precise models use appropriate rate conventions and dividend timing.
Is fair value the same as basis?+
Not exactly. Basis is commonly the actual futures price minus the spot index. Fair value is the modelled theoretical futures price. Net basis can mean actual futures price minus theoretical futures price.
Does futures basis predict whether stocks rise or fall?+
No. A positive or negative raw basis can reflect routine financing and dividend mechanics. It is not independently a directional prediction or reliable trade signal.
Do futures and spot converge at expiry?+
Index futures are designed to converge to the relevant settlement reference by expiry, but the precise final settlement procedure and reference time must be verified for each product.
Does MES have the same fair value as ES?+
MES and ES reference the same S&P 500 index and share the same conceptual basis economics, but each contract has its own order book and its dollar value per point is different: MES $5 and ES $50.
Is NQ fair value calculated the same way as ES?+
The finance-minus-expected-dividends approach generally applies to Nasdaq-100 index futures relative to the Nasdaq-100 cash index, using that index’s own level, expected dividends and the chosen expiry.
Why can overnight ES differ from the last SPX close?+
ES trades outside normal US stock-market hours while the official cash-index print can remain unchanged. Comparing live overnight futures against an earlier SPX close mixes timestamps.
What is the difference between futures fair value and contango?+
Futures fair value compares one expiry to today’s underlying cash index, while contango describes later-dated futures being more expensive than nearby futures for the same underlying.
Can I use SPY instead of SPX for basis?+
An ETF can be used as an approximate hedge or proxy only after unit normalisation and accounting for ETF mechanics, distributions and tracking differences. Its share price is not the same unit as the SPX index.
Can you trade futures fair-value mispricing risk-free?+
No. A modelled gap may be untradable after spreads, funding, hedge tracking, timing, taxes and market impact. A futures position remains exposed to market and operational risk.
How do I backtest an ES-SPX fair-value strategy?+
Use the actual tradable ES expiry, synchronised index values, documented financing/dividend models, realistic costs and an explicit rollover policy. Avoid back-adjusted continuous futures for precise historical basis calculations.
Where can I learn the official calculation?+
CME Group publishes educational pages on calculating equity-index futures fair value and understanding index-futures basis. Exact contract rules and the applicable product settlement methodology should be checked separately.
Futures workflows
Explore the strategy side of TradeLuma.
Browse TradeLuma's futures strategy catalogue and the chart, rollover, and reference methodology used for each published strategy.
Explore futures strategies →Continue learning
Related guides.
CPI vs PCE Inflation Explained: Why Gold, Nasdaq & Futures React
Learn how US CPI and PCE inflation differ, what headline and core readings reveal, and why surprises can move gold, Nasdaq and Treasury futures.
US Treasury Yields Explained: 2-Year vs 10-Year, Yield Curve Inversion & Market Impact
Understand US 2-year vs 10-year Treasury yields, yield curve inversion, real yields and the potential impact on gold, Nasdaq and Treasury futures.
CME FedWatch Tool Explained: How Rate Cut Probabilities Work
Learn how CME FedWatch calculates Fed rate-cut probabilities from Fed Funds futures, read upcoming FOMC outcomes, and interpret changing odds for gold, stocks and bonds.