
Futures
CME FedWatch Tool Explained: How Rate Cut Probabilities Work
Learn how CME FedWatch calculates Fed rate-cut probabilities from Fed Funds futures, read upcoming FOMC outcomes, and interpret changing odds for gold, stocks and bonds.
On this page+
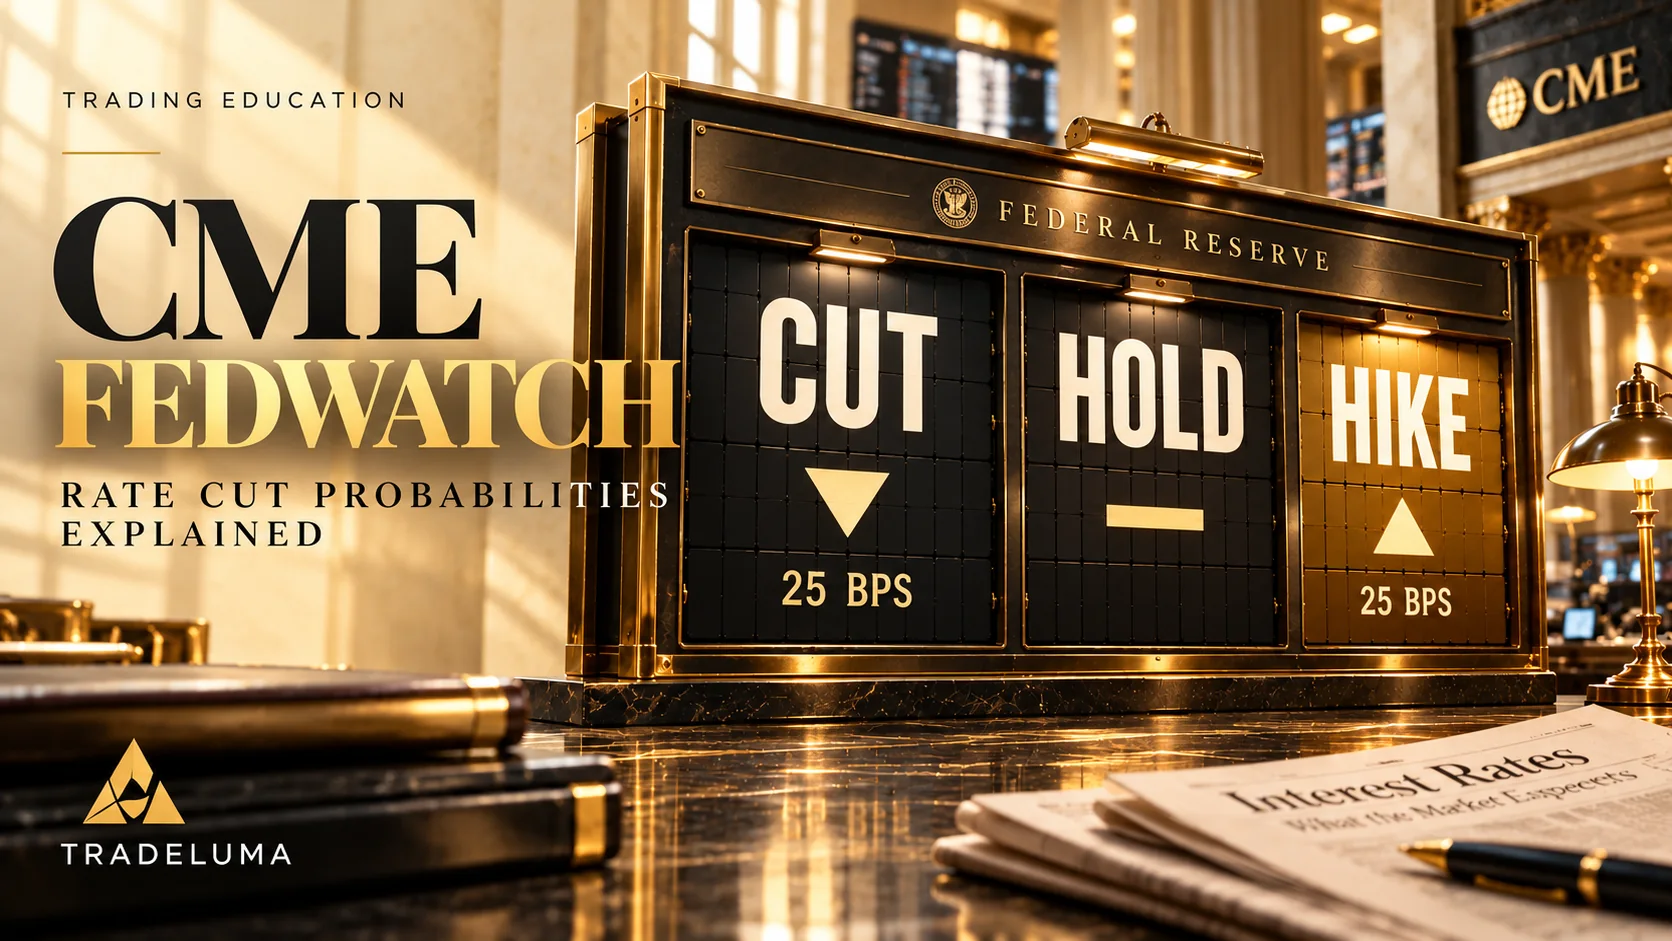
CME FedWatch shows how interest-rate futures markets price possible Federal Reserve decisions at upcoming FOMC meetings. If you see a headline saying the market assigns a 70% chance to a 25-basis-point cut, that is a model-based estimate inferred from futures prices—not a poll of Fed officials, a guaranteed outcome or a trading signal. This TradeLuma guide explains what the percentages mean, why they change, how a Fed Funds futures price relates to an interest rate, and how to use FedWatch without confusing market expectations with the market reaction. Every percentage and numerical scenario in this article is hypothetical unless clearly identified otherwise.
What is the CME FedWatch Tool?
CME FedWatch is an interest-rate expectations dashboard published by CME Group. It turns prices of 30-Day Federal Funds futures into model-implied probabilities for possible target-rate outcomes at scheduled Federal Open Market Committee (FOMC) meetings. Traders use it to monitor how the market is pricing upcoming decisions rather than relying on one commentator’s opinion.
For each meeting, the interface presents possible target-rate ranges and associated probabilities. Depending on the selected view, it can also compare today’s pricing with one day, one week or one month ago, display longer-term historical changes and show the Fed dot plot. These are different ways of looking at the same market-implied expectations, not separate official forecasts.
Quick answer: how does FedWatch calculate rate-cut probabilities?
The short explanation is that a 30-Day Fed Funds futures price implies an average effective overnight rate for a calendar month. If an FOMC meeting occurs during that month, the monthly average combines days before and after the decision. CME uses adjacent contracts, the meeting calendar and a probability-tree methodology to infer how much the market prices a hold, cut or hike.
The method makes simplifying assumptions, including rate changes in 25-basis-point increments and a proportional response of the effective rate to changes in the target. It is therefore more accurate to say “futures-implied probabilities under CME’s methodology” than to call the output the Fed’s probability of acting.
What are 30-Day Federal Funds futures?
30-Day Federal Funds futures, generally referenced by the product code ZQ, are exchange-traded futures tied to the arithmetic average effective federal funds rate for a specific calendar month. They are not securities that pay the FOMC target range directly and they are not a wager on only one meeting day.
That monthly nature matters: a contract that includes an FOMC decision can average several days at the previous rate and the remaining days at a new rate. Consequently, a small expected monthly-average change can imply a much larger expected change in the end-of-month overnight rate.
Fed target rate versus effective federal funds rate
The Federal Reserve communicates a target range for the federal funds rate. The effective federal funds rate, often abbreviated EFFR, is an observed market rate published by the Federal Reserve Bank of New York. It usually trades inside or near the target range, but it is not identical to the range’s upper bound, lower bound or midpoint.
Fed Funds futures settle against the calendar-month average EFFR. To infer probabilities for a target-range decision, FedWatch models how that effective rate changes when the Fed adjusts the target. Mixing the two benchmarks carelessly produces misleading rate-cut calculations.
Why is a Fed Funds futures price quoted near 100?
The standard rate-futures quotation relationship is implied rate in percent = 100 minus futures price. For example, a hypothetical quote of 96.20 implies a monthly-average effective rate of 3.80%. A quote of 96.45 implies 3.55%. When expected overnight rates fall, this futures price generally rises, all else equal.
This arithmetic converts a quoted futures price into an implied calendar-month average. It does not by itself say “the Fed will cut 25 basis points with 100% probability.” Meeting dates, the current effective rate and surrounding months still have to be considered.
Why meeting timing changes the calculation
Suppose, solely for illustration, an FOMC decision becomes effective halfway through a 30-day month. If the starting EFFR is 4.00% and the post-meeting rate would be 3.75%, a month split into 15 days before and 15 days after that change would average 3.875%. Its corresponding simplified futures quote would be 96.125.
The monthly-average shift is only 12.5 basis points even though the full post-meeting move is 25 basis points. A meeting near the end of the month would influence fewer days, making the monthly average less sensitive. Actual calculations need the relevant effective date, calendar-day count and other contract information.
A worked example: turning expected basis points into probabilities
Imagine a simplified one-meeting, two-outcome setting with only “hold” or “cut 25 basis points.” Suppose the futures-implied expected end-of-period rate change is minus 17.5 basis points after properly accounting for the meeting-month weighting. With those two outcomes, 17.5 divided by 25 equals 0.70. That corresponds to an illustrative 70% cut probability and 30% hold probability.
This example is a teaching shortcut, not a replication of today’s FedWatch. For multiple possible moves, meetings in successive months, unusual effective-rate behaviour or changes in the meeting calendar, the full probability tree must be used. Do not calculate live odds from one raw monthly price without adjusting the time window.
How to read the next FOMC meeting panel
Start by identifying the exact meeting date at the top of FedWatch. The nearest upcoming meeting usually appears first. Next, read the listed target-rate ranges and their probabilities. A panel may show multiple outcomes such as a 25-basis-point cut, no change or a 25-basis-point hike relative to the existing target range.
If a table displays 55% for a lower target range and 45% for unchanged, that is the distribution of model-implied outcomes for the selected meeting, not an assertion that the lower range is desirable or certain. Always check what starting range and event date the comparison uses.
What do CUT, HOLD and HIKE mean on a FedWatch chart?
CUT means a reduction in the FOMC target range, HOLD means no change, and HIKE means an increase. The accompanying “25 bps” means one quarter of a percentage point, not a 25% change. Two moves of 25 basis points total 50 basis points, or half a percentage point.
The TradeLuma hero artwork uses a stylised CUT / HOLD / HIKE split-flap board to illustrate these possibilities. It is artistic and not a live CME dashboard, and no probabilities are depicted as current market data.
Probabilities of a cut versus probabilities of each target range
The probability of “any cut” combines the probabilities of all possible target-rate ranges below the current range. Likewise, “any hike” combines all ranges above. The probability for one specific 25-basis-point target change is narrower than the total probability for one or more cuts.
If the possible outcomes are a 25-basis-point cut at 60%, a 50-basis-point cut at 10% and hold at 30%, the total implied probability of at least one cut is 70%. Quoting only the 60% figure as “the probability of a cut” would omit the larger-cut scenario.
Why later FOMC meetings need extra care
A future meeting panel can represent a distribution of target-rate levels reached by that date, incorporating what might happen at earlier meetings. This is not necessarily the probability of a single isolated decision at that later meeting. The path of possible 25-basis-point steps is central to CME’s probability-tree methodology.
For example, a lower target-rate range three meetings from now might arise from a cut at the next meeting, a later cut or multiple smaller sequential changes. It is unsafe to subtract two headline probabilities and label the result the odds of one meeting’s action.
Understanding unconditional and conditional probabilities
Unconditional probabilities refer to the distribution of rate outcomes for a meeting without fixing the result of prior meetings. Conditional probabilities describe an outcome assuming a specified earlier path. FedWatch’s methodology constructs possible paths of rate moves and combines them into cumulative target-rate distributions.
This distinction matters when a news headline says “markets see three cuts by December.” That language can be shorthand for the average number of 25-basis-point steps priced across the path, not a promise of exactly three distinct meetings with cuts.
How to compare current odds with yesterday or last month
Use the Current and Compare views to inspect how the probability distribution changed. A 70% cut probability today versus 40% a week earlier indicates a substantial repricing toward a cut, although the probability does not measure the future equity-market return.
Look for the catalyst: an inflation release, employment surprise, central-bank comments, liquidity change or a repricing of other related interest-rate markets. Keep meeting date, target-range definitions and update time constant when comparing screenshots.
Using FedWatch historical probabilities
The Historical view shows how the pricing for a selected meeting evolved over time. It is useful for understanding when a consensus formed, where expectations reversed and how fast incoming data changed market positioning. A steep shift may reveal a macroeconomic surprise but does not prove which headline caused it.
For research, save the observation date and the particular FOMC meeting being priced. “Cut probability on October 24” has little analytical meaning without a meeting date. Use CME’s downloadable historical data if you need a reproducible series rather than screenshots.
FedWatch versus the Federal Reserve dot plot
FedWatch expresses market-implied expectations derived from prices. The Fed dot plot reports individual FOMC participants’ projections of appropriate policy rates at future dates, collected at scheduled economic projection releases. They represent different populations, time horizons and assumptions.
The two can disagree. Markets may expect weaker growth or a faster inflation decline than the Fed participants’ median projection implies. Conversely, the dot plot may suggest a slower path than futures prices discount. Neither is a guaranteed forecast; Fed officials can update their assessments as conditions change.
Is FedWatch the same as a prediction market?
No. FedWatch derives probabilities from an interest-rate futures market through a model. It is not a direct price for a binary yes/no contract on one particular FOMC decision. The futures price reflects an expected monthly average effective rate and may incorporate risk premia, liquidity effects and basis differences.
Both tools can communicate odds, but their underlying contracts and settlement mechanics differ. Comparing them is useful only when event dates, definitions of “cut” and probability conventions match.
What economic releases usually move FedWatch?
Consumer price inflation, core inflation measures, employment growth, wage data, unemployment, activity indicators and unexpected central-bank communications can all change expectations for monetary policy. The size of the surprise relative to consensus is often more important than whether a single economic number looks high or low in isolation.
For example, a cooler-than-expected inflation release may encourage a larger expected cut, while unexpectedly persistent wage inflation may shift pricing toward a hold. But the result can depend on the Fed’s broader goals and conditions; a single report never guarantees a particular meeting outcome.
How FedWatch expectations can affect gold futures
Gold is sensitive to real interest rates, the US dollar, inflation concerns and risk sentiment. A repricing toward easier monetary policy can support gold if real yields fall and the dollar weakens, but this is not automatic. A cut priced because of severe growth concerns may coincide with a rush for liquidity or abrupt changes in risk appetite.
The informative question is not just “will the Fed cut?” It is “how have expected real yields and the dollar changed relative to what traders had already priced?” Gold futures can move before, during and after the actual FOMC announcement.
How rate expectations interact with Nasdaq and S&P futures
Lower expected policy rates can lift the present value of long-duration corporate cash flows, a narrative often associated with growth-heavy indices such as Nasdaq. At the same time, a surprise growth slowdown can damage earnings expectations and push equities lower despite greater cut odds.
For ES, MES, NQ and MNQ traders, compare FedWatch shifts with Treasury yields, earnings expectations, volatility and broader market breadth. A mechanical rule that “higher cut probability means buy Nasdaq” ignores key drivers and risks large losses around announcements.
How FedWatch relates to US Treasury futures and yields
Interest-rate expectations affect the front end of the Treasury yield curve most directly, while longer maturities additionally reflect inflation compensation, term premia and growth expectations. When yields fall, existing fixed-coupon Treasury prices generally rise, but changes in the curve and duration mean different contracts react differently.
One FOMC probability reading cannot substitute for analysing the entire yield curve, cash-bond futures basis or delivery mechanics. Traders should know their specific Treasury futures contract’s duration-like exposure rather than treating every rate product as interchangeable.
The decision versus the surprise: why price can move the other way
Suppose markets had already assigned 90% probability to a 25-basis-point cut. If the Fed delivers that cut, much of the decision may already be reflected in prices; the market response may depend more on the statement, press conference, economic projections or unexpected vote split.
Now imagine the Fed holds instead. That may cause a larger price adjustment because the outcome differed sharply from prior pricing. Price moves also reflect positioning, risk management and subsequent communication. A known decision and a favourable trade are not the same thing.
What happens to FedWatch after an FOMC decision?
Once a meeting outcome is known, the relevant meeting’s probability no longer functions as an uncertain future event. Attention shifts to the next scheduled meeting and the path of rates thereafter. New futures quotes can quickly incorporate the statement, press conference and the market’s view of subsequent policy.
When recording research, capture whether a screenshot was taken before the decision, after the statement or after the press conference. Even on the same day, those three observations can carry materially different information.
Common mistakes when interpreting FedWatch
Avoid treating the probabilities as a direct survey of central bankers; confusing the effective rate with the target midpoint; applying 100 minus futures price directly as a meeting probability; assuming later-meeting odds describe one isolated decision; and calling every move in a bar chart a prediction of what gold or Nasdaq will do.
Other pitfalls include ignoring the observation timestamp, mixing historical and current views, treating model outputs as certainties, failing to account for pre-priced expectations and overlooking spreads or market liquidity in the underlying futures contracts.
Can automated trading systems use FedWatch?
An automated strategy can use changes in market-implied rate expectations as one research input, but it needs a licensed, reliable data source, reproducible timestamps, a defined interpretation of meetings and controls for missing or revised values. Do not scrape a visually displayed number and assume it is a low-latency execution feed.
TradeLuma is an execution-routing and risk-control platform, not a source of policy forecasts. A strategy that uses macro-event signals still needs appropriate position sizing, maximum loss controls, safe handling of order rejections and an explicit plan for volatile announcement windows.
A practical FedWatch checklist for futures traders
Before using the tool, write down the meeting date, target range, observation date and time, the outcomes shown and their combined probabilities. Compare that exact meeting with an earlier snapshot. Note the release or event that may have changed expectations, and separate rate pricing from price trends in the traded asset.
Before placing an order, review contract specifications, margin, spread, liquidity, volatility, overnight risk and the possibility of slippage. Decide in advance what constitutes an invalid thesis. This is a research workflow rather than a recommendation to trade a particular event.
Where to find the official CME FedWatch Tool
The official dashboard is on CME Group’s website under Markets, Interest Rates, CME FedWatch Tool. CME also publishes a User Guide, a methodology explanation and historical probability resources. Use the official materials when checking methodology changes or comparing screenshots from different dates.
Because the dashboard is live, an article dated October 2026 should not print a current “next meeting” percentage as though it were permanent. The worked percentages in this guide are intentionally hypothetical so the explanation remains useful as market pricing changes.
Final takeaway: read the change in expectations, not only the headline odds
CME FedWatch is most valuable when used to understand how market-implied policy expectations have moved and why. Read the exact meeting, possible target ranges and rate path, then compare those implied outcomes with macroeconomic data and prices across assets.
A market-implied probability is an estimate derived from a particular futures market and model. Sound trading decisions require separate analysis of the price already paid for the expectation, the risks of a surprise and the ability to execute safely.
Frequently asked questions
What is CME FedWatch?+
It is a CME Group tool that converts 30-Day Fed Funds futures prices into model-implied probabilities for possible Federal Reserve target-rate outcomes at upcoming FOMC meetings.
How accurate are CME FedWatch probabilities?+
They are market-implied model estimates, not guaranteed forecasts. Their calibration varies with time horizon, contract liquidity, market conditions and the methodology’s assumptions.
How do you read the CME FedWatch Tool?+
Choose the specific upcoming FOMC meeting, identify the possible target-rate ranges and compare their probabilities. Use Current, Compare and Historical views to see how pricing has changed.
How does CME calculate the probability of a rate cut?+
It starts with 30-Day Fed Funds futures prices, converts them into monthly-average implied effective rates and applies meeting-calendar weighting and a probability tree with model assumptions about 25-basis-point steps.
Is a 70% chance of a cut the Fed’s own prediction?+
No. It is a futures-implied estimate of market pricing under CME’s assumptions. It is not published as a probability forecast by the Federal Reserve.
Does the FedWatch percentage change during the day?+
Yes. As Fed Funds futures prices change, the tool’s implied probabilities can change. Compare timestamps and data sources before drawing conclusions.
What does 25 basis points mean?+
It means 0.25 percentage points. A reduction from 4.00% to 3.75% is a 25-basis-point cut.
What is the Fed Funds futures price formula?+
The simple quote-to-rate relationship is implied monthly-average annualised rate (in %) = 100 minus futures price. A quote of 96.20 implies 3.80%, not an 80% probability.
What is the difference between EFFR and the target rate?+
EFFR is an observed market rate published by the New York Fed. The FOMC announces a target range; the two are related but not identical.
Does a rate-cut probability include multiple cuts?+
A broad “any cut” probability can combine several lower target-range outcomes. The probability for exactly one 25-basis-point cut is only one possible outcome.
Why do rate-cut odds move after CPI or jobs data?+
Economic surprises can change expectations for inflation, growth and the Federal Reserve policy path. Fed Funds futures reprice and FedWatch’s model-implied probabilities change.
Does a higher rate-cut probability mean gold will rise?+
Not necessarily. Gold also responds to real yields, the dollar, inflation expectations and liquidity. A rise in cut odds may already be reflected in the gold price.
Does a Fed rate cut always make Nasdaq rise?+
No. Lower discount rates may support valuations, but weak growth, negative earnings surprises, volatility and positioning can outweigh that effect.
Is CME FedWatch the same as the Fed dot plot?+
No. FedWatch reflects futures-implied market expectations, whereas the dot plot collects FOMC participants’ projections of appropriate policy rates.
Can I trade directly on the FedWatch Tool?+
FedWatch is an informational dashboard, not a buy/sell signal. Trading Fed Funds futures or related products involves separate brokerage access, risk limits and contract specifications.
What does the FedWatch Historical tab show?+
It tracks how implied outcome probabilities for a selected FOMC meeting changed over time. It is useful for analysing repricing and locating expectation shifts.
Why do later-meeting probabilities look different?+
They often reflect cumulative target-rate levels across a sequence of possible prior policy decisions, so they are not simply independent forecasts of each meeting.
Where can I see CME FedWatch live?+
Use the official CME Group FedWatch Tool page. Always check the selected FOMC meeting date and timestamp; screenshots in articles may be outdated.
Futures workflows
Explore the strategy side of TradeLuma.
Browse TradeLuma's futures strategy catalogue and the chart, rollover, and reference methodology used for each published strategy.
Explore futures strategies →Continue learning
Related guides.
FOMC Meeting October 2026: Fed Rate Decision Time, Expectations & Gold/Nasdaq Impact
October 2026 FOMC decision time in New York and Australia, Fed rate expectations, statement and press conference explained, plus gold and Nasdaq trading risks.
CPI vs PCE Inflation Explained: Why Gold, Nasdaq & Futures React
Learn how US CPI and PCE inflation differ, what headline and core readings reveal, and why surprises can move gold, Nasdaq and Treasury futures.

US Treasury Yields Explained: 2-Year vs 10-Year, Yield Curve Inversion & Market Impact
Understand US 2-year vs 10-year Treasury yields, yield curve inversion, real yields and the potential impact on gold, Nasdaq and Treasury futures.