
Futures
Contango vs Backwardation in Futures: Curves, Roll Yield & Examples
Understand contango and backwardation in futures, why curves slope up or down, how roll yield works, and what it means for oil, gold and rollover.
On this page+
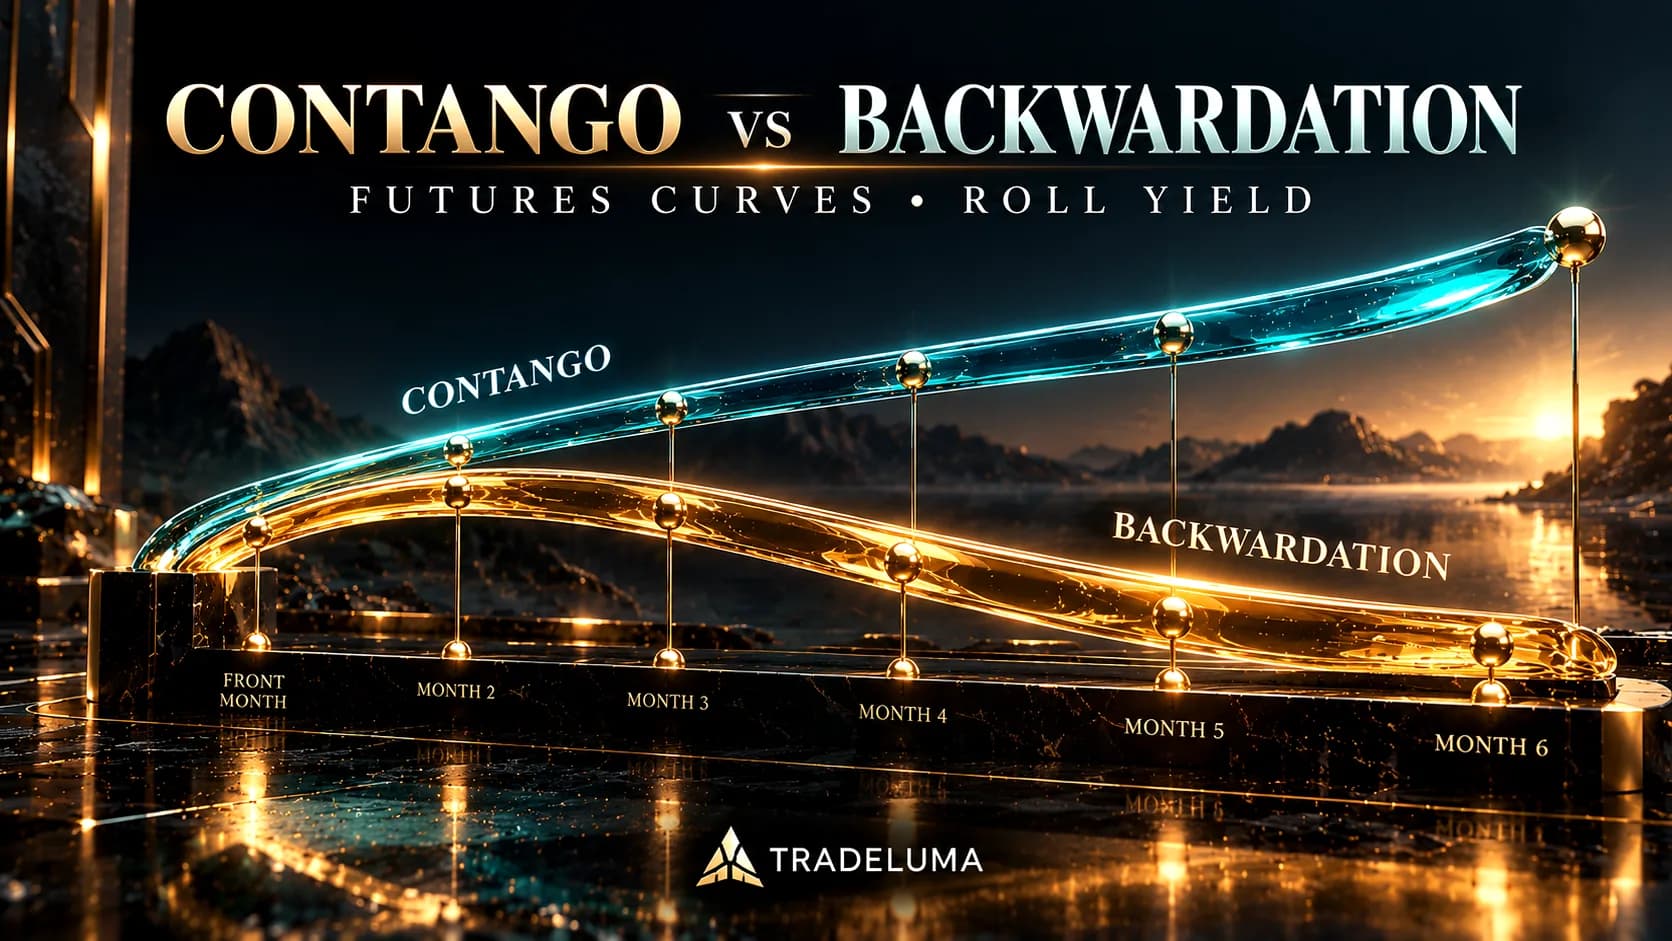
Two futures contracts on the same commodity can have different prices simply because they expire in different months. When later contracts cost more than nearby contracts, traders call the structure contango; when nearby contracts cost more, they call it backwardation. This difference matters when analysing oil, gold, seasonal commodities and strategies that hold exposure across multiple expiries. This guide explains futures curves, cost of carry, convenience yield, calendar spreads and roll yield with concrete examples—without confusing curve shape with a guaranteed price forecast or treating a contract roll as an instant profit or loss.
Contango vs backwardation: the quick answer
Contango describes a futures term structure in which later-dated contracts trade at higher prices than nearer-dated contracts. Backwardation describes the opposite: nearby futures trade at higher prices than contracts expiring later. The comparison should use the same underlying commodity and compatible contract specifications at the same observation time.
These words describe a snapshot of relative delivery-month prices, not a forecast that prices must move up in contango or down in backwardation. A futures curve can change shape while the outright market rises, falls or stays approximately flat.
What is a futures curve?
A futures curve plots the current prices of contracts for different future delivery or settlement months. The horizontal axis represents expiry; the vertical axis represents the quoted futures price. In crude oil, for example, a trader might compare November, December, January and later WTI contracts in one snapshot.
Each point is an actual contract with its own order book, maturity and potentially different liquidity. A curve is not a historical price chart, because it compares several maturities at one moment rather than showing one instrument across successive days.
How to recognise contango on a chart
Suppose the same oil product trades at $70 for the nearby contract, $71 for the next month, and $72 for the following month. That upward progression is a simple example of contango between those expiries. The $70, $71 and $72 quotes are illustrative, not live market prices.
The important quantity is the calendar spread: deferred futures price minus nearby futures price. In this example the one-month spread is +$1 per barrel. A positive spread under this convention indicates that the later contract is more expensive.
How to recognise backwardation on a chart
Suppose instead that nearby oil trades at $75, the next month at $73, and the following month at $72. Nearby supply is priced more highly than later supply, producing a downward-sloping curve known as backwardation. Again, these numbers are illustrative only.
Using the same deferred-minus-nearby spread convention, the first calendar spread is −$2 per barrel. Always state the subtraction order: traders also quote calendar spreads as nearby minus deferred, which reverses the sign.
Contango vs backwardation comparison at a glance
Contango: deferred price is generally above nearby price; the curve slopes upward; holding the physical commodity can involve financing, storage and insurance costs; a repeated long front-month roll may face an unfavourable roll-return component if the structure persists.
Backwardation: nearby price is generally above deferred price; the curve slopes downward; immediacy or scarce available inventory may command a premium; a repeated long front-month roll may receive a favourable roll-return component if the structure persists. Neither structure guarantees a particular trading profit.
Why contango happens: cost of carry
For storable commodities, a common starting point is cost of carry. Someone holding inventory today may incur financing interest, warehousing, insurance and other storage expenses before delivering it months later. Those costs can support a futures premium over near-term cash supply.
This is a simplifying framework, not a mechanical requirement that every deferred contract must be more expensive. Interest rates, seasonality, available storage, hedging pressure and expected supply can all affect the observed spread.
Why backwardation happens: convenience yield and scarcity
Physical inventory can have a non-cash benefit: immediate access can prevent a refinery, smelter or production line from shutting down. Economists call this benefit convenience yield. When available inventories are tight, that benefit can outweigh storage and financing costs.
Backwardation therefore often appears when prompt supply is especially valuable. It does not prove a permanent shortage or justify buying a contract without considering the entire risk and liquidity picture.
Spot price versus two listed futures expiries
Some introductions define contango and backwardation by comparing a futures contract with spot. Traders also use the terms for the slope between nearby and deferred futures contracts. Those are related but not identical comparisons, particularly when cash and futures markets have different trading conventions.
For a robust research report, record exactly which comparison is being made: spot versus a particular maturity, front month versus second month, or a fitted curve across multiple maturities. A broad label such as “oil is in contango” can hide a humped or mixed-shaped curve.
Does contango mean the market will rise?
No. An upward futures curve means a later-dated contract costs more today than a nearer-dated contract today. It does not mean today’s front-month price is forecast to rise at the same rate. The market may be reflecting carrying costs or risk premia rather than a directional prediction.
Likewise, a downward curve does not mean the spot market must decline. Price direction and term-structure shape are two different variables, and treating them as interchangeable can lead to faulty trading rules.
What is roll yield?
Roll yield is the component of return associated with maintaining futures exposure as contracts age and a strategy moves from one expiry to another. It is often discussed alongside changes in the spot price and returns on collateral. The way the components are measured depends on the return decomposition and index methodology used.
A key distinction: selling a $70 nearby contract and buying a $72 deferred contract does not, by itself, create an immediate $2 realised loss. The trader has exchanged one exposure for another at their respective market prices. The roll-return effect emerges through relative contract-price evolution and the maintained-exposure strategy over time.
Why a persistent contango curve can hurt a long rolling strategy
Imagine a long-only strategy that regularly replaces an expiring front-month contract with a more expensive deferred contract while the same curve shape persists. As the deferred contract ages, its price may move toward the nearby or spot price, creating a negative roll-return component even if the headline commodity price is relatively stable.
This is often called negative roll yield. It is conditional, not certain: a commodity price rally or an unexpected curve change can outweigh the effect. The exact outcome depends on timing, roll rules, settlement prices, fees and market changes.
Why backwardation can support a long rolling strategy
In a backwardated curve the deferred contract costs less than the nearby contract. If the structure stays broadly similar as time advances, the deferred contract may move toward the higher nearby price, contributing a positive roll-return component for a maintained long strategy.
The benefit is not guaranteed and is not a standalone signal to buy. Futures prices, curve slope and volatility can all change before a position is rolled. Total profit and loss must be measured from actual trades or a well-specified rolled-futures index.
Worked WTI example: interpreting calendar spreads
Assume illustrative CL prices of $74.50 for one maturity and $72.80 for the next. Nearby minus deferred equals +$1.70 per barrel, a backwardated calendar spread. Standard WTI CL represents 1,000 barrels, so a one-contract calendar spread has $1,700 of gross price differential at that instant.
That $1,700 is not a free profit and is not the return from rolling. A calendar-spread trade carries offsetting outright futures positions, spread movements, margin requirements and transaction costs. Actual gains and losses arise from how the spread changes between entry and exit.
Gold futures: why the curve may behave differently from oil
Gold is typically durable, widely held and relatively inexpensive to store relative to its value. Financing and the opportunity cost of carrying inventory are often important to its term structure. Crude oil is more sensitive to usable storage, transport bottlenecks and demand for physical prompt barrels.
Those differences can help explain why contango may appear regularly in one market and sharp backwardation in another. Compare like-for-like maturities and annualise spreads carefully if you want to compare markets with different delivery-month intervals.
Natural gas and seasonal curve shapes
Natural gas futures often reflect seasonal demand and storage patterns. A summer contract and a winter contract may have different prices because the physical economics of those delivery periods differ, not because the entire market fits a simple monotonically rising or falling line.
A seasonal or humped curve can contain both contango and backwardation between different adjacent months. Label the specific spread rather than forcing an entire year of deliveries into one category.
Calendar spreads versus outright futures trades
An outright position expresses exposure to the price of a contract. A calendar spread expresses exposure to the price difference between two expiries of the same underlying futures product. The spread can move even when both outright contract prices move in the same direction.
Calendar spreads may have different liquidity, implied matching and broker margin treatment. They still require a clear rule for contract months, expiry, fills and the spread quotation convention.
How contract rollover affects a continuous futures chart
A continuous futures chart stitches successive contracts into one time series. When two months trade at different prices, changing the chart’s reference contract can introduce a gap that is not a market move in one tradable contract. Back-adjusted series may remove that visual discontinuity by modifying historical levels.
Back-adjustment is useful for trend analysis, but adjusted historical prices are not always executable prices. A strategy should record the underlying contract months, the historical stitching method and the actual fills whenever it measures roll-related outcomes.
Does backwardation make futures ETFs better investments?
Some commodity funds obtain exposure by rolling futures rather than storing physical commodities. Their performance can therefore differ from a spot-price headline, and the sign and persistence of roll-return effects may matter to long-run tracking.
An ETF’s exact exposure depends on the contract selection and roll schedule, its expense ratio, collateral management, cash returns and tracking methodology. Backwardation alone cannot establish that a particular fund is attractive or suitable.
How to calculate the curve slope
For a simple calendar-spread quote, subtract the nearby price from the deferred price. Positive means contango under that convention and negative means backwardation. A percentage spread can be calculated as (deferred − nearby) ÷ nearby × 100, but a percentage over one month is not directly comparable with the same percentage over six months.
If annualising, state the calendar basis and the time between expiries. Avoid describing an annualised spread as a guaranteed annual return: the spread is a current relationship, whereas investment returns depend on future price paths.
Why futures curves can change abruptly
Inventory reports, weather, transport constraints, geopolitical events, interest-rate expectations, refinery disruptions and shifts in producer or consumer hedging can move one delivery month more than another. A curve can flatten, steepen or switch sign while the nearby commodity price barely changes.
Monitor both the outright price and a defined set of relevant calendar spreads. A single snapshot cannot show how stable the shape has been or whether the market is repricing a short-lived delivery bottleneck.
What automated futures traders should monitor
A robust automated workflow must map each signal to a tradable expiry and understand the active rollover date. If a strategy includes term-structure rules, those inputs should identify the exact month pair and measurement time, not a vague “front-month” label that changes without notice.
Useful controls include checking spread quote freshness, contract expiry and first-notice restrictions, available volume and open interest, tick values, account-level exposure and the difference between back-adjusted research data and actual order prices.
Backtesting a contango or backwardation strategy
Use timestamp-aligned prices for specific expiries, a fixed method for choosing month pairs, realistic rollover timing, fees and slippage. Avoid using the curve observed at the end of the day to make a hypothetical intraday decision that occurred earlier.
Test multiple market regimes. Evaluate returns against outright futures benchmarks, isolate the effect of the roll rule, include adverse spread excursions and stress periods when the curve rapidly changes from backwardation to contango.
Common mistakes with futures term structure
Common errors include treating contango as a bullish price forecast, assuming a favourable curve guarantees positive performance, describing the roll-price difference as an instant realised gain or loss, and comparing contracts with inconsistent units or timestamps.
Other mistakes include using an adjusted continuous price as if it were an executable contract, ignoring fees and margin, and assuming every commodity has a smooth curve rather than seasonal or local distortions.
A practical contango and backwardation checklist
Before interpreting a curve, identify the underlying commodity, the exact contract months, the quote timestamp, the price unit, the spread sign convention and whether the comparison uses cash, futures or both. Check whether seasonality and nearby inventory dynamics could explain the shape.
Before trading or automating, separately evaluate directional risk, expiry deadlines, liquidity, roll rules, costs and account limits. Treat futures-curve shape as one measurable input, not a promise of future returns.
Frequently asked questions
What is contango in futures?+
Contango is a term-structure condition in which later-dated futures typically trade at a higher price than nearer-dated futures or spot. It describes relative contract prices at a point in time, not a prediction that the asset will rise.
What is backwardation in futures?+
Backwardation occurs when nearer-dated futures generally trade above later-dated contracts. It can reflect a premium for immediate physical supply, among other influences.
What is the difference between contango and backwardation?+
Contango is an upward-sloping futures curve; backwardation is a downward-sloping curve when maturities are compared consistently. The slope refers to contract prices across expiries, not price direction over time.
Does contango mean prices are going up?+
No. Higher deferred futures prices today do not ensure that the near-term or spot price will rise in the future.
Does backwardation mean prices will fall?+
No. Backwardation describes nearby prices exceeding deferred prices today; future outright price direction remains uncertain.
What causes contango?+
Financing, storage, insurance, hedging and other cost-of-carry factors can make deferred commodity delivery more expensive. Market-specific conditions also matter.
What causes backwardation?+
Tight prompt supply or a high convenience yield from holding physical inventory can make nearby delivery more valuable than deferred delivery.
What is roll yield in futures?+
Roll yield describes a return component associated with maintaining futures exposure while contracts age and are replaced. It is not an immediate guaranteed gain or loss equal to the price difference between two contracts.
Is roll yield positive in backwardation?+
A persistent backwardated curve can support a positive roll-return component for a rolling long strategy, but changes in prices or curve shape can offset it.
Is contango bad for traders?+
Not inherently. Persistent contango can weigh on some long-only rolling strategies, but short positions, calendar spreads and other approaches have different exposures. Total outcomes depend on actual trades and costs.
What is the front-month futures contract?+
The front month is commonly the nearest active expiry, though vendors and traders can use liquidity or rollover conventions that differ near expiration.
How do you measure futures curve slope?+
A simple method is deferred futures price minus nearby futures price. Positive values indicate contango under that sign convention; negative values indicate backwardation.
Is backwardation common in crude oil?+
Crude oil can alternate between contango and backwardation depending on storage, inventories, immediate demand and supply disruptions. The current shape must be verified for specific WTI contract months.
Can a futures curve be partly contango and partly backwardation?+
Yes. Seasonal or humped curves may slope upward between some months and downward between others. Identify the specific calendar spreads being compared.
Does rollover automatically create a trading loss in contango?+
No. Buying a more expensive deferred contract is not by itself a realised loss. Roll-return effects develop through the subsequent price evolution of a maintained futures position, while trades also incur transaction costs.
How does a continuous futures chart affect term-structure analysis?+
A continuous chart may stitch different expiries and back-adjust historical prices. Use actual contract-month quotations and a documented roll rule when measuring curve shape or realised trading performance.
Futures workflows
Explore the strategy side of TradeLuma.
Browse TradeLuma's futures strategy catalogue and the chart, rollover, and reference methodology used for each published strategy.
Explore futures strategies →Continue learning
Related guides.
Open Interest vs Volume in Futures: How to Read Market Participation
Learn what futures open interest measures, how it differs from volume, what rising or falling OI means, and how rollover affects the data.
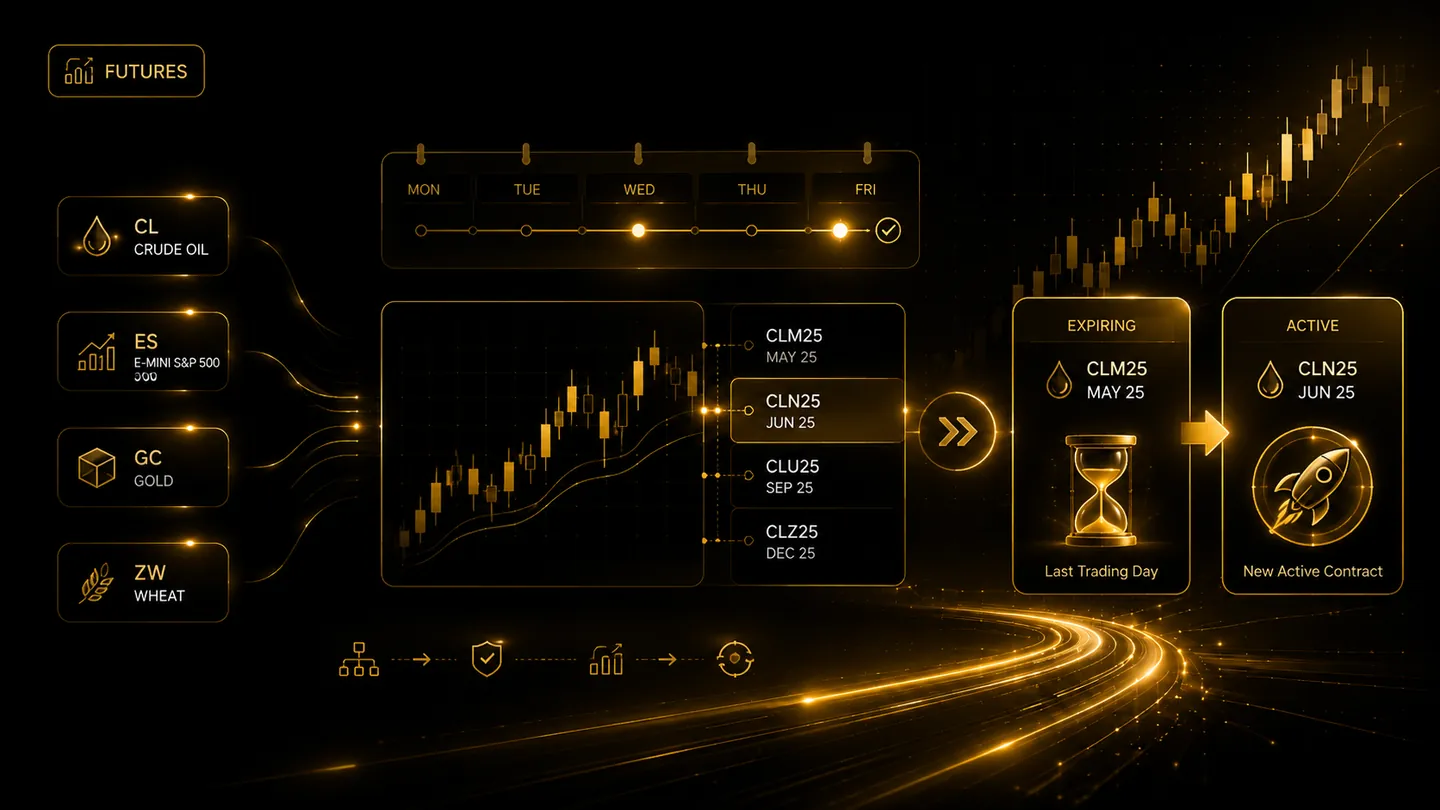
Continuous futures charts vs tradable contracts: what automation must map correctly
Understand why chart symbols such as continuous futures are useful for analysis but live orders require a specific broker-tradable contract.

Futures Trading Hours: CME Globex, RTH, Overnight Sessions & Daily Breaks (2026 Guide)
Learn when futures markets open and close, including CME Globex hours for ES, MES, NQ, MNQ, Gold and Crude Oil, plus RTH, overnight sessions, breaks and time zones.