
Trading Foundations
Multiple Timeframe Analysis: How to Align Trend, Setup and Entry
Learn how traders combine higher, intermediate, and lower timeframes to separate market context from setup location and entry timing.
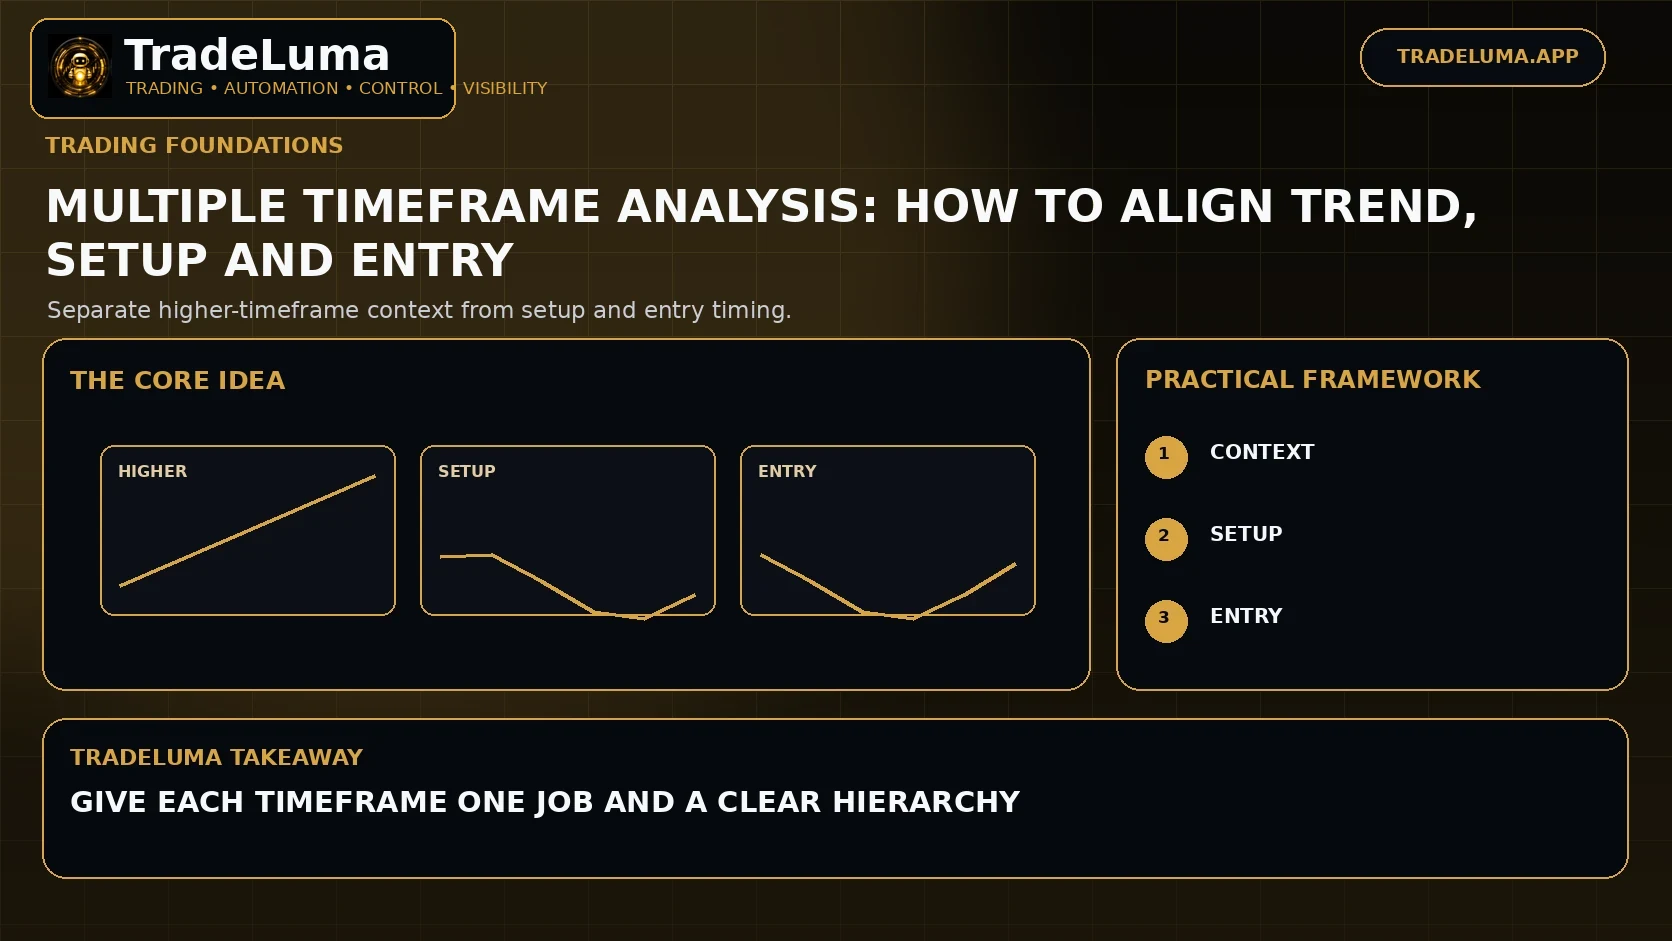
Multiple timeframe analysis uses more than one chart interval to separate strategic context from tactical execution. A higher timeframe can describe the dominant trend and major levels, an intermediate timeframe can define the setup, and a lower timeframe can refine the trigger. The approach can reduce tunnel vision, but too many charts can create conflicting signals and hindsight unless each timeframe has a specific job.
Why use more than one timeframe
A five-minute chart can show a clear short-term downtrend while the daily chart remains in a strong uptrend. Both observations can be true because they describe different scales of price movement.
Multiple timeframe analysis helps the trader decide whether the short-term move is a tradeable reversal, a pullback inside the larger trend, or simply noise.
The higher timeframe
The higher timeframe is commonly used for dominant trend, major support and resistance, volatility regime, and important swing structure. It should be slow enough to provide stable context for the intended holding period.
A day trader might use hourly or four-hour context, while a swing trader might use daily or weekly context. There is no universal combination.
The setup timeframe
The setup timeframe is where the trader identifies the pattern or condition they actually want to trade: pullback, breakout, range edge, momentum continuation, or mean reversion.
Keeping this role separate from the entry trigger prevents a lower timeframe from constantly changing the core thesis.
The entry timeframe
A lower timeframe can refine risk by identifying a smaller structure break, rejection, or momentum trigger inside the broader setup zone. This can create a tighter stop and more precise timing.
However, lower timeframes also contain more noise. Requiring perfect micro-confirmation can cause the strategy to miss valid trades or enter too late.
Timeframe ratios
Some traders use a rough multiple between timeframes, such as four to six times the lower interval, to ensure each chart provides meaningfully different information. The exact ratio is not a rule.
What matters is that the timeframes are far enough apart to show distinct structure but close enough to remain relevant to the same trade horizon.
When timeframes disagree
Conflicting signals are normal. A higher-timeframe uptrend can contain a lower-timeframe downtrend during a pullback. The strategy should define whether disagreement means no trade or creates a specific counter-trend setup.
Without a hierarchy, the trader can always find one chart that supports the desired position, which makes the process subjective.
Aligning trend and entry
A common framework trades only in the higher-timeframe direction and waits for the lower timeframe to turn back with it after a pullback. This uses the slow chart for direction and the fast chart for timing.
Another framework deliberately trades counter-trend reversals, but then the higher-timeframe trend becomes a risk factor rather than an entry filter.
Avoiding analysis overload
More timeframes do not automatically mean more information. Watching six or eight intervals can produce endless contradictions and encourage discretionary cherry-picking.
Limit the chart set to the minimum needed for context, setup, and execution, and document exactly what each one contributes.
How to backtest multi-timeframe rules
Historical testing must ensure higher-timeframe values are only known after those bars close when the strategy requires confirmed data. Using incomplete future information can create look-ahead bias.
Test whether each timeframe filter improves expectancy after costs. If a filter removes many good trades without materially reducing bad ones, it may add complexity without value.
Frequently asked questions
What is multiple timeframe analysis?
It is the use of two or more chart intervals to separate broader market context from the specific setup and entry trigger.
Which timeframes should I use together?
The combination should match the holding period. Many traders use a slower chart for context and a faster chart for execution, but there is no universal best ratio.
What if the higher and lower timeframes disagree?
That is common. The strategy should define a hierarchy—such as trading only with the higher-timeframe trend—or clearly specify when counter-trend trades are allowed.
Can multi-timeframe backtests have look-ahead bias?
Yes. If the test uses a higher-timeframe bar before it has actually closed, it can accidentally use information that would not have been available at the time.
Continue learning
Related TradeLuma guides
Trading Foundations
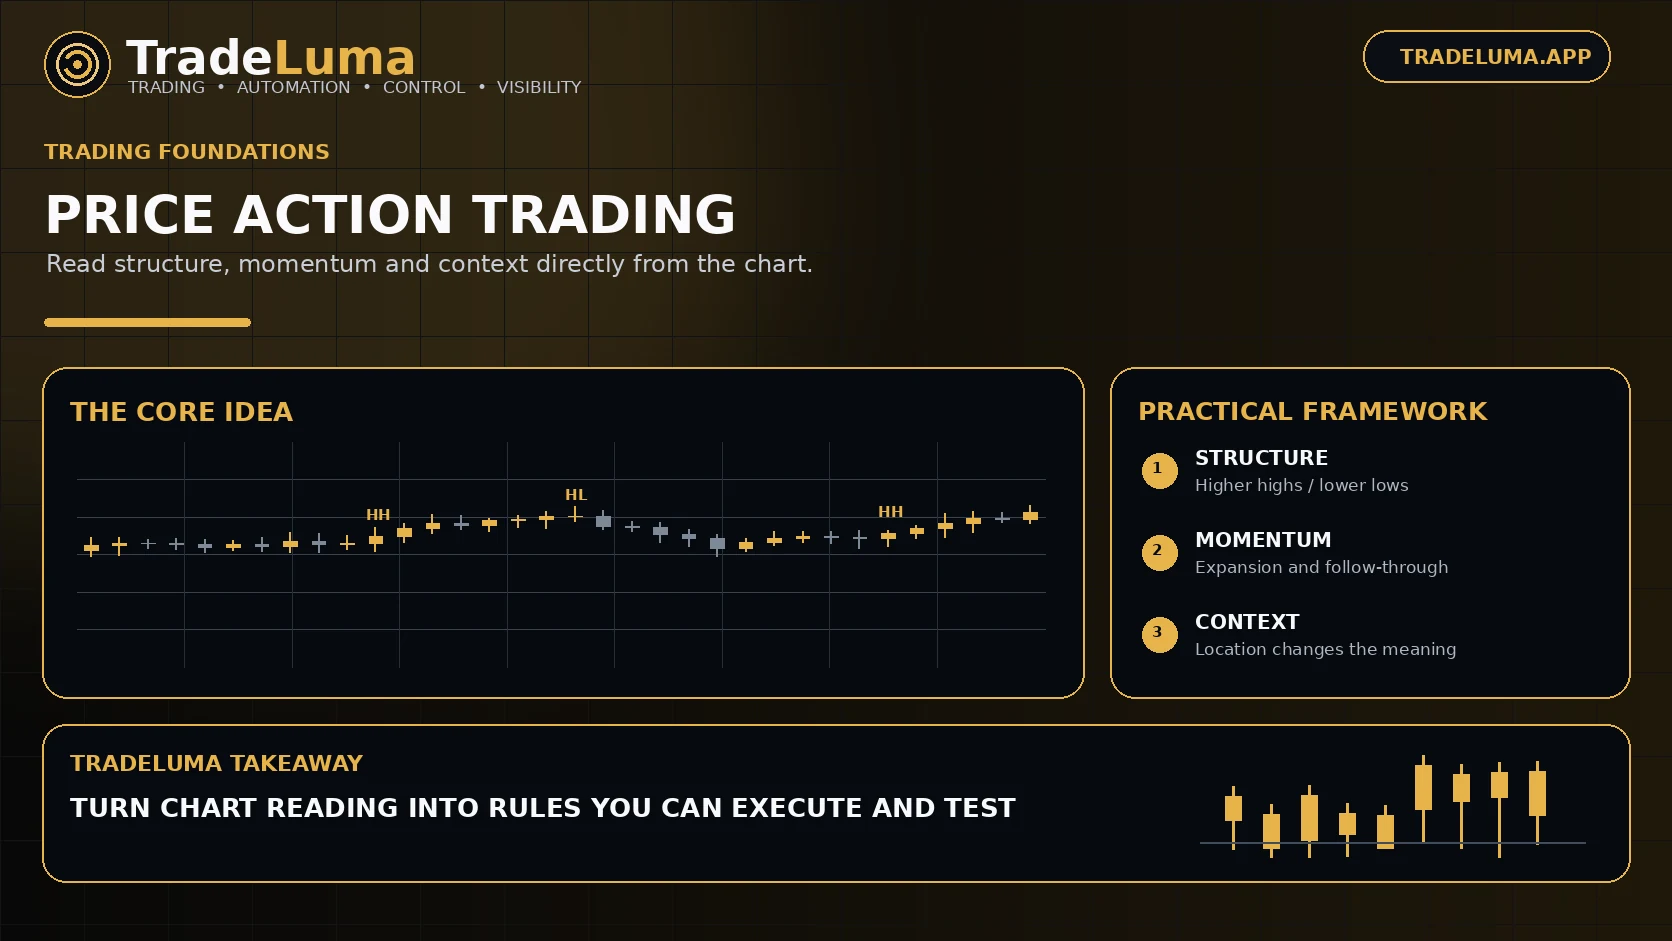
Price Action Trading Guide: Market Structure, Momentum and Context
26 Aug 2026 · 12 min read
Trading Foundations
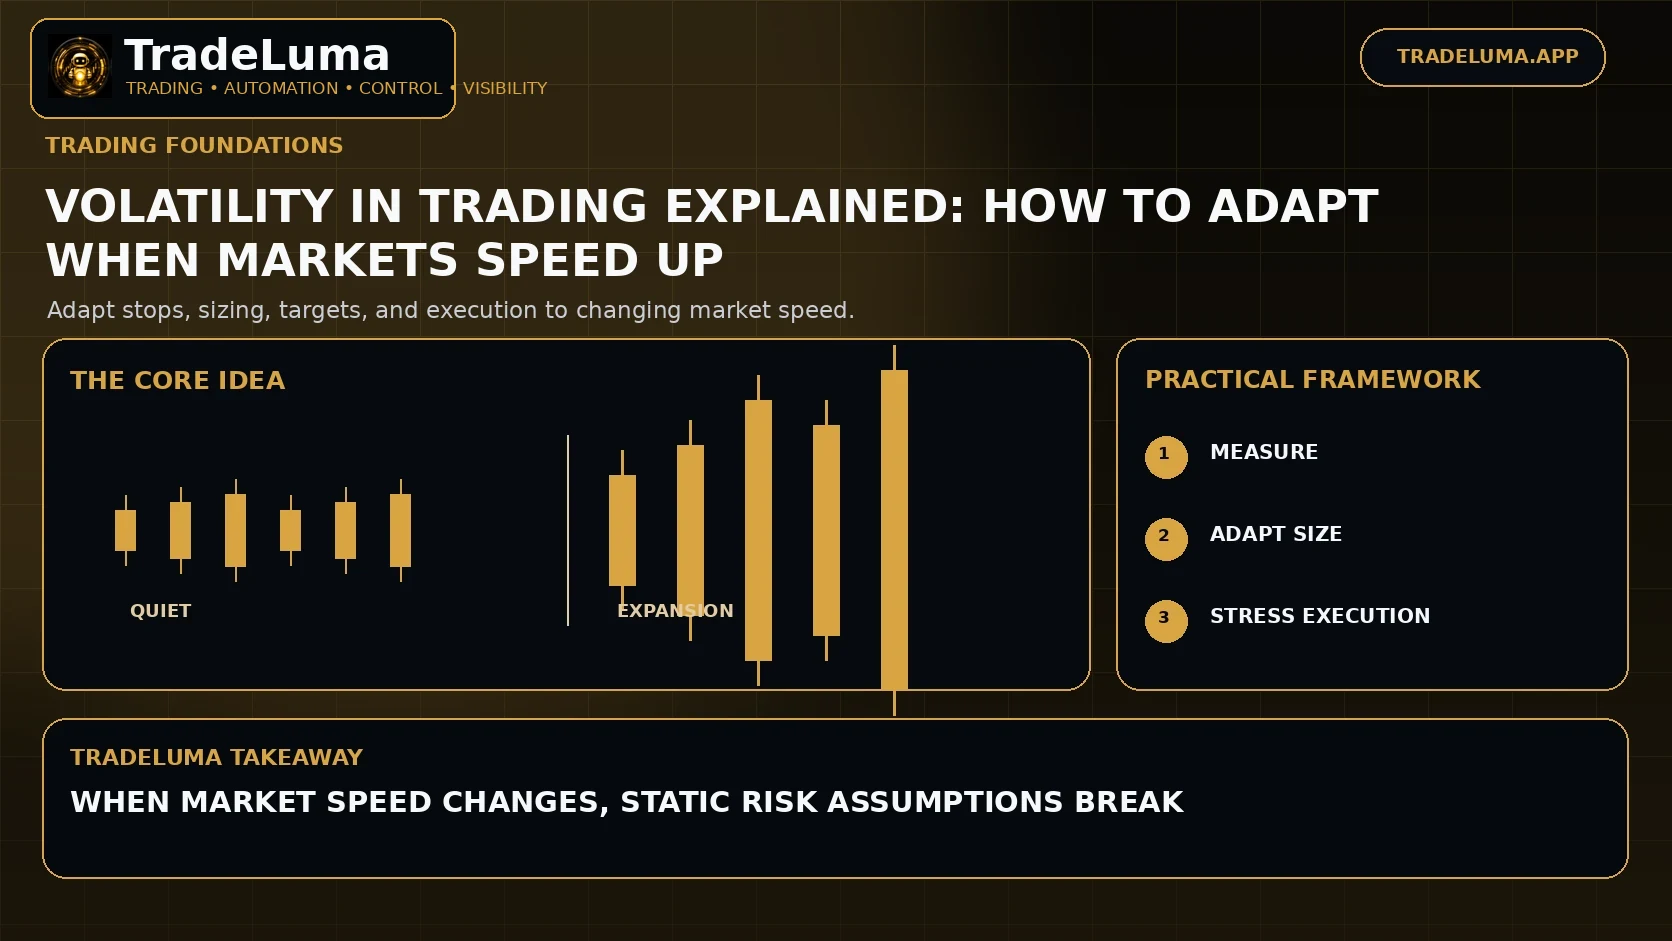
Volatility in Trading Explained: How to Adapt When Markets Speed Up
8 Sept 2026 · 11 min read
Trading Foundations
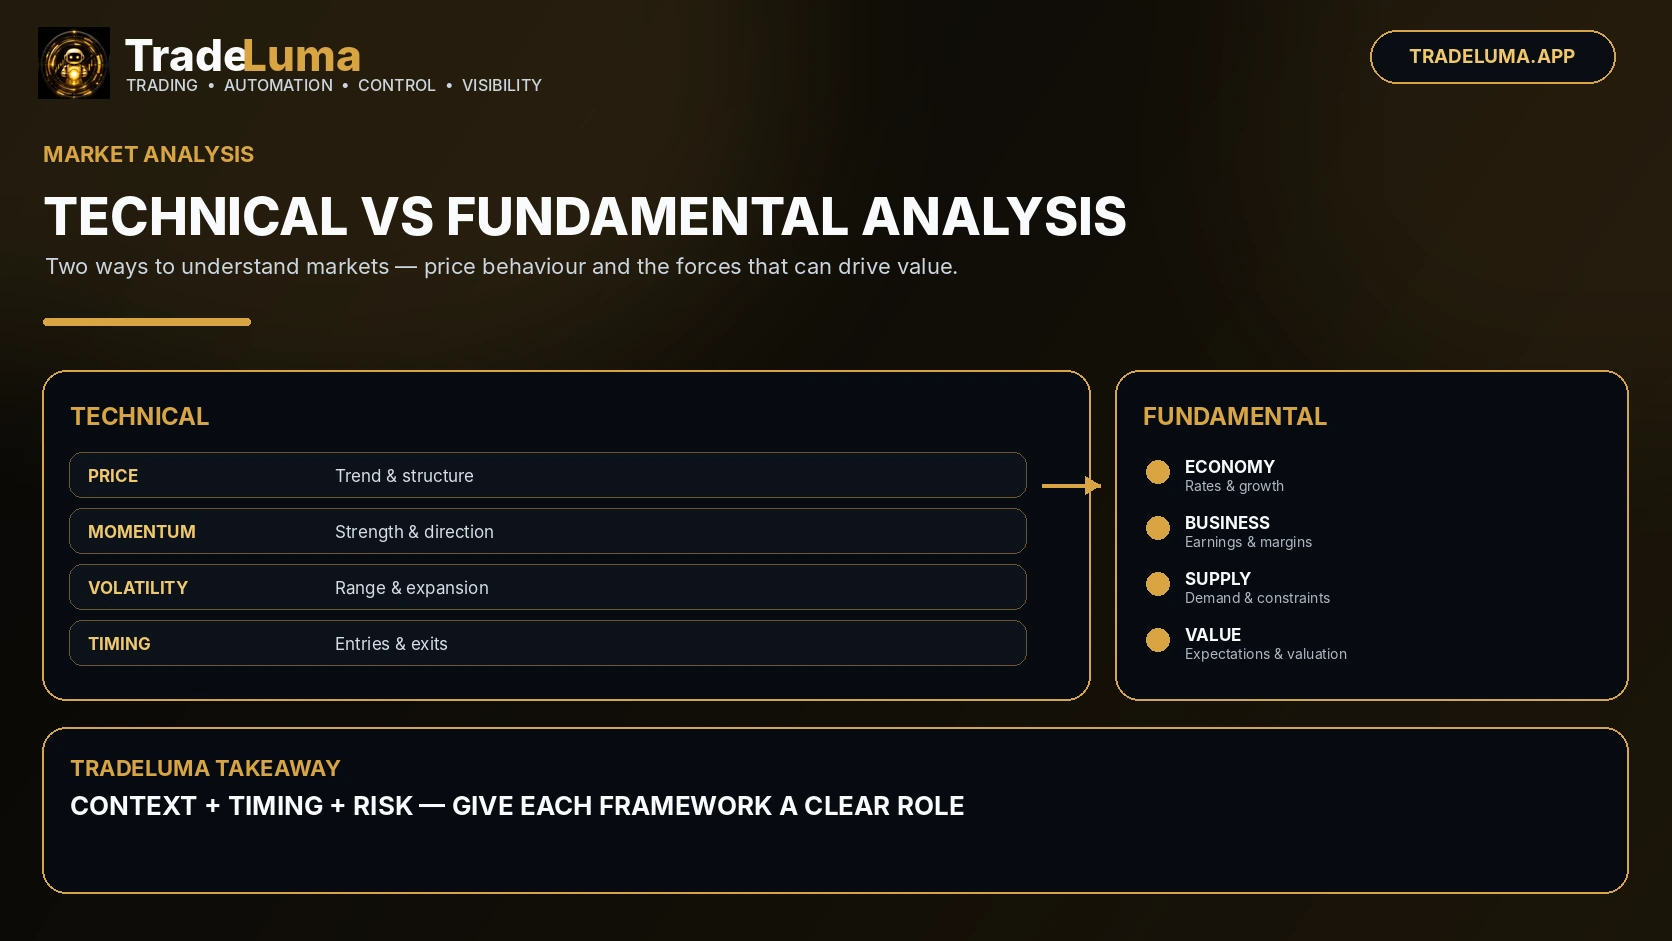
Technical vs Fundamental Analysis: Key Differences for Traders
18 Aug 2026 · 12 min read
Build a controlled automation workflow with TradeLuma
Configure alerts, test in paper mode, apply execution controls, and follow broker outcomes from one workspace.