
Strategy Research
How to Backtest a Trading Strategy: A Practical Step-by-Step Guide
Learn how to backtest a trading strategy from written rules to clean data, realistic costs, out-of-sample checks, robustness testing, and final review.
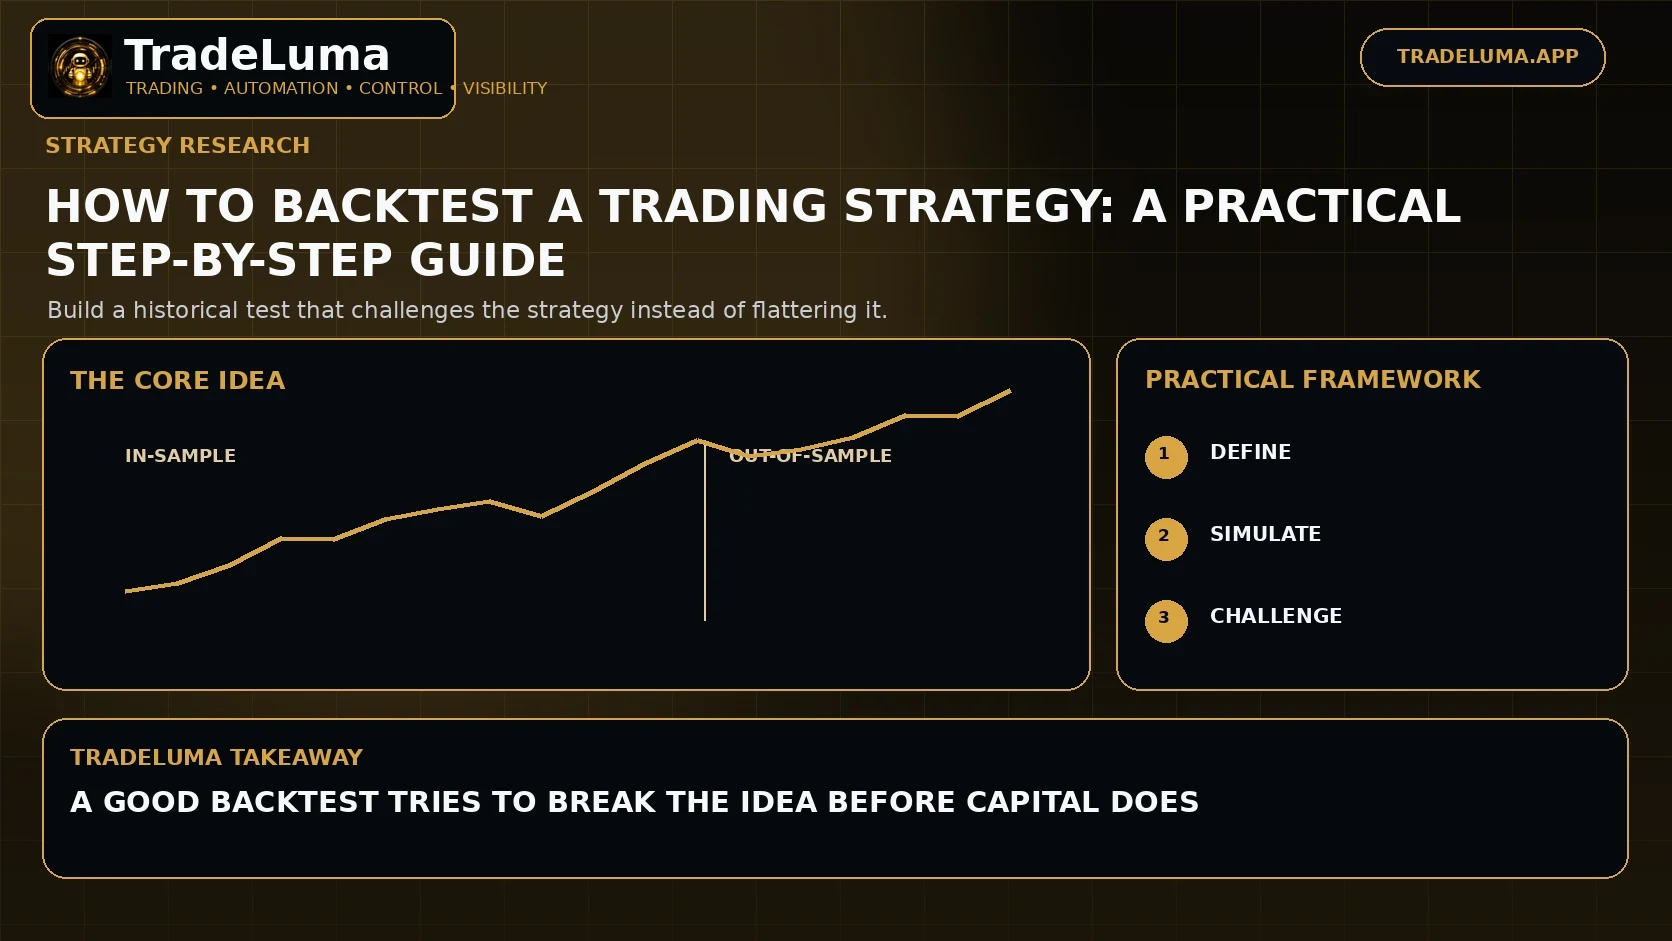
Backtesting asks a simple question: how would a clearly defined trading strategy have behaved on historical data if its rules had been followed consistently? A useful backtest is more than a profit chart. It requires unambiguous rules, appropriate data, realistic commissions and slippage, protection against look-ahead bias, and enough out-of-sample evidence to challenge the idea rather than merely confirm it.
Step 1: write the hypothesis
Start with a plain-language reason the strategy might work. Examples include trend persistence, mean reversion after an extreme, breakout expansion after compression, or a behavioural response around a recurring market event.
The hypothesis does not need to be correct, but it helps prevent random combinations of indicators from becoming a strategy merely because the equity curve looks attractive.
Step 2: define every rule
Specify the market, timeframe, trading session, entry trigger, filters, stop, target or exit, position sizing, maximum exposure, and conditions that block new trades. Ambiguous phrases such as strong trend or clean breakout should be converted into measurable definitions.
If a rule cannot be reproduced consistently, the backtest may be measuring discretion rather than the strategy itself.
Step 3: prepare appropriate data
Use data that matches the instrument and timeframe. For futures, decide how continuous contracts and rollovers are handled. For equities, understand whether corporate actions are adjusted. For intraday strategies, confirm session times and daylight-saving behaviour.
Missing bars, bad prints, and inconsistent time zones can create false entries or exits, so data cleaning is part of the research process.
Step 4: model realistic execution
Include commission, spread, slippage, contract value, and order-type behaviour. A limit order that traded at the historical low is not guaranteed to have filled, and a stop can fill worse than its trigger during fast movement.
Execution assumptions should become more conservative as the target gets smaller or the strategy trades faster because costs consume a larger share of expected profit.
Step 5: avoid look-ahead bias
A backtest must only use information that was available at the decision time. Using the final value of an unfinished higher-timeframe bar, future swing confirmation, or revised data can make the historical result impossible to reproduce live.
Check every indicator and multi-timeframe input for when its value becomes known, not just what value is eventually plotted on the chart.
Step 6: choose in-sample and out-of-sample periods
The in-sample period is used to develop and calibrate the rules. The out-of-sample period is held back to evaluate whether the idea survives data it was not designed around.
Once the out-of-sample results influence another round of tuning, that period is no longer truly unseen. Repeated reuse gradually turns it into additional training data.
Step 7: review more than net profit
Important statistics include number of trades, win rate, average win, average loss, expectancy, profit factor, maximum drawdown, time in market, consecutive losses, and distribution of returns.
A high net profit from a small number of trades or one extraordinary outlier may be less reliable than a more modest result supported by a broader sample.
Step 8: test robustness
Move key parameters slightly, test neighbouring timeframes where appropriate, examine different market regimes, and use walk-forward analysis. A robust strategy should not collapse because one lookback changes from 20 to 21.
Stress commissions and slippage beyond the expected level. If a small deterioration removes all profitability, the live edge may be too fragile.
Step 9: inspect individual trades
Summary statistics can hide coding or logic errors. Review examples from winners, losers, unusual gaps, session boundaries, and contract roll periods to confirm the strategy behaves as intended.
Trade-by-trade inspection is also useful for identifying whether profits depend on one era, one instrument, or one rare market event.
Step 10: paper trade before live deployment
A historical backtest cannot reproduce every operational detail of live execution. Paper trading can validate alert timing, order mapping, broker behaviour, position sizing, and the difference between expected and actual fills.
If the strategy progresses to live trading, start with risk that is small enough to measure implementation quality without turning the first operational mistake into a major loss.
Keep a research log
Record each version, hypothesis, parameter change, reason for the change, and result. This prevents circular experimentation and makes it easier to distinguish a genuine improvement from another round of overfitting.
A research log also preserves rejected ideas. Knowing what failed and why can be as valuable as remembering the final version that survived.
Frequently asked questions
What is backtesting in trading?
Backtesting applies a defined trading strategy to historical data to estimate how its rules would have behaved under specified execution assumptions.
How much historical data do I need?
There is no fixed amount. The test should include enough trades and market regimes to challenge the strategy, with an appropriate balance between history and relevance to current market structure.
What is out-of-sample testing?
It evaluates a strategy on data that was not used to design or optimise the rules, providing a harder test of whether the observed edge may generalise.
Why can a profitable backtest fail live?
Common reasons include overfitting, look-ahead bias, poor data, unrealistic fills, higher costs, changing market regimes, and operational differences between simulated and live execution.
Continue learning
Related TradeLuma guides
Strategy Research
Walk-forward and out-of-sample testing for automated strategies
24 July 2026 · 9 min read
Strategy Research
Backtesting mistakes to avoid before automating a trading strategy
23 July 2026 · 10 min read
Strategy Research
Win rate, profit factor, expectancy, and drawdown: reading strategy results properly
22 July 2026 · 9 min read
Build a controlled automation workflow with TradeLuma
Configure alerts, test in paper mode, apply execution controls, and follow broker outcomes from one workspace.